Bitcoin - 7/12/19 - Messy Chart!
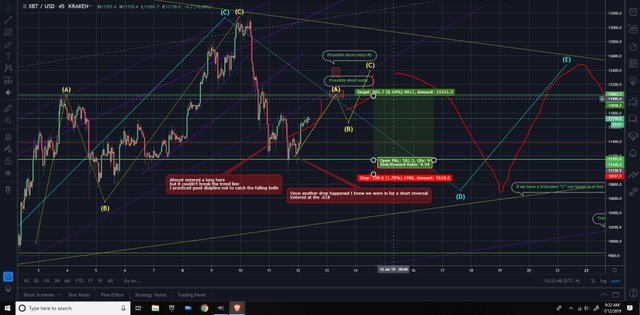
Ok after the large move down Bitcoin tried to reverse, but as I noted on my chart yesterday it was getting rejected on the trend-line,hard! I watched it fight that trend-line for a few hours, before it gave up!! Sending it down one last time, I got excited and decided to enter. Placed my buy at the .618 of the "2" wave, after a "1"wave was theorized. Really good entry risking 2% to gain 8%!! I'm up 4.5% atm, lets see if we hit my target!! I have a short placed right above my target, as I believe once target is reached we will head down noted with a "B" wave on my chart. If not I will double up my short at the second possible short entry. In a perfect situation I will close it(my short) and go long again up to "C", then shorting again. We will see, up and with a tight stop loss I'm happy and confident!!
The short targets were moved slightly higher from yesterdays chart. I had to re-adjust after the last move downward.
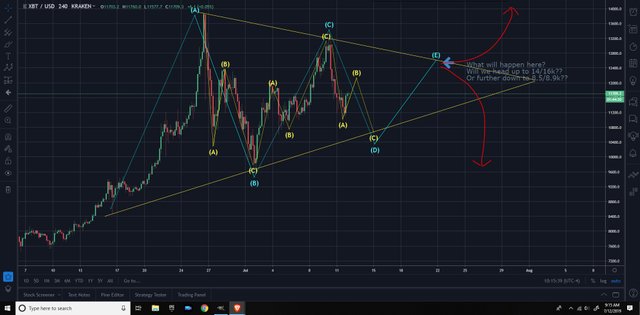
The last few days I have felt confident because I'm locked into the count. Here is a cleaned up chart and what I expect to happen. Where I'm lost is what's going to happen once we reach that "E". This movement will determine what count we are in for the long term. This is not financial advice! This is more of my trading journal than anything!
bitcoin has been super messy from the start
Lol! True, all my trend lines is my problem! I’d rather have to many than not enough!
Posted using Partiko iOS