Visualizing the History of Bitcoin Crashes
Hello Steemains
Visualizing the History of Bitcoin Crashes
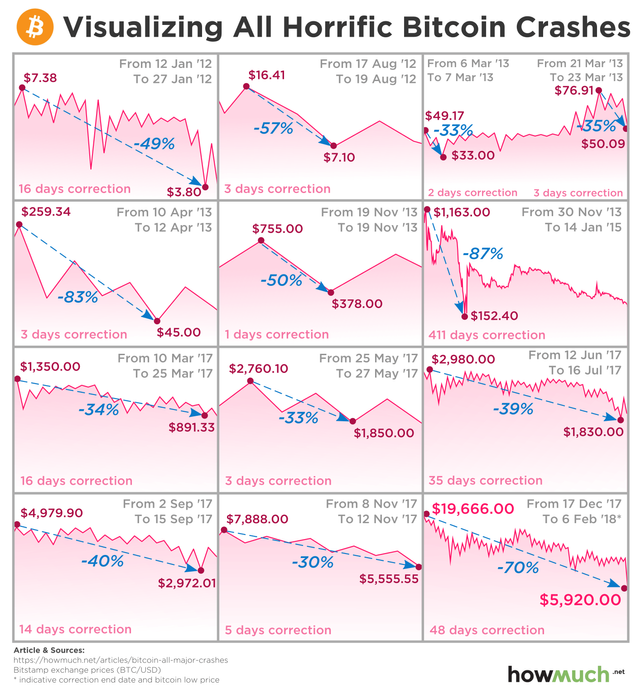
Here is a breakdown of the visual, showing each of the corrections in Bitcoin by date of occurrence. It will also include the percent of value loss and the length of the correction in number of days:
January 12, 2012 – January 27, 2012, -30%, 16 Days
August 17, 2012 – August 19, 2012, -57%, 3 Days
March 6, 2013 – March 7, 2013, -33%. 2 Days
March 21, 2013 – March 23, 2013, -35%, 3 Days
April 10, 2013 – April 12, 2013, -83%, 3 Days
November 19, 2013 – November 19, 2013, -50%, 1 Day
November 30, 2013 – January 14, 2015, -87%, 411 Days
March 10, 2017 – March 25, 2017, -34%, 16 Days
May 25, 2017 – May 27, 2017, -33%, 3 Day
June 12, 2017 – July 16, 2017, -39%, 35 Days
September 2, 2017 – September 15, 2017, -40%, 14 Days
November 8, 2017 – November 12, 2017, -30%, 5 Days
December 17, 2017 – February 6, 2018, -70%, 48 Days
Overall, the latest correction in the price of Bitcoin is nothing out of the ordinary
Keep calm! All the best.
Thanks
Perspective is so important in all things. This is a great visual representation helping to put things in perspective in regards to a mostly free market for a new world-changing commodity. Thanks!
If this big crash is an indication of the big reversal that will follow than I can't wait;-).
Thank you for sharing this information with us
https://cointelegraph.com/news/tom-lee-predicts-bitcoin-to-reach-91000-by-march-2020-based-on-performances-after-past-dips
all the horrific crashes lead to the beautiful all time highs of the coin . so keep calm and enjoy the NEW ATH of the coin :P
https://www.coindesk.com/financial-stability-board-downplays-crypto-impact-on-global-finance/
good news:-)