Road to the Moon for Bitcoin- A Technical Perspective
I posted this on another blog before my membership here was approved. As the post still holds good now, I'm sharing it here as well for the community to view.

Yesterday, I posted a chart to my twitter feed highlighting the various resistance levels we may have to deal with before we are actually clear to entering back into a sustained bull-phase. 24 hours later, seems like we are still dealing with the first resistance level I marked on the chart & I thought, maybe it’s time I explained what we may be up to deal with in the future. especially for those who aren’t really good chart readers and may not be able to understand what I was trying to explain through the chart.
Zoomed outa bit on my $BTC Charts and came up with this analysis for us to go back into a sustained bull phase #ToTheMoon $BTCUSD #Cryptocurrency #Crypto #Bitcoin #HODL pic.twitter.com/jgYjy82Ha6
CryptoLala (@saleemlala) February 7, 2018

I’m no bear, but as a trader, I think it’s important that I look for every opportunity to swing in the market.
P.S. In the chart I posted on my twitter, I have marked the $9200-$9400 levels twice. The Second one was meant to be $11850-$12050 levels.
First Resistance- The 200 Days Moving Average
Now for all those who don’t understand what a 200 Day Moving Average (commonly referred to as the 200DMA), let me first explain Moving Averages in terms of technical analysis.
A Moving Average is calculated by deriving the arithmetic mean or average of a given set of values. These values, plotted on a chart and connected with each other help us in creating a curved trendline which help us in identifying the trend.
An Upward sloping moving average indicates bullishness, and a downward sloping moving average indicates bearishness. It must be noted that these moving averages are lagging indicators and may not necessarily indicate the current trend.
A 200 DMA is a simple calculation of the Moving Average by taking the prices of the last 200 days. In the world of trading, this is one of the most commonly used & respected moving average as it usually ends up being a strong support when the prices are above it or a resistance when the price is below it. An indication of the importance & relevance of this moving average can be analysed by a tweet I posted a couple of days where several cryptos bounced immediately of the 200 DMA.
Want to know the power of the #200DMA?$BTC $LTC $DASH $ZEC #Crypto #Cryptocurrency pic.twitter.com/WYtGk3RC2L
CryptoLala (@saleemlala) February 3, 2018
It must be noted that 200DMA as a support or resistance doesn’t mean to be an exact price, a small price range around it can be considered a support or resistance. This means that even if the price doesn’t necessarily touch the 200DMA, the price may resist or bounce close to the 200 DMA. Alternatively, even if the price manages to breach the 200DMA, but doesn’t have strength, it may end up going back below or above the 200DMA, depending on the direction from which it approached it. You may be able to understand this better based on the analysis for Bitcoin below:
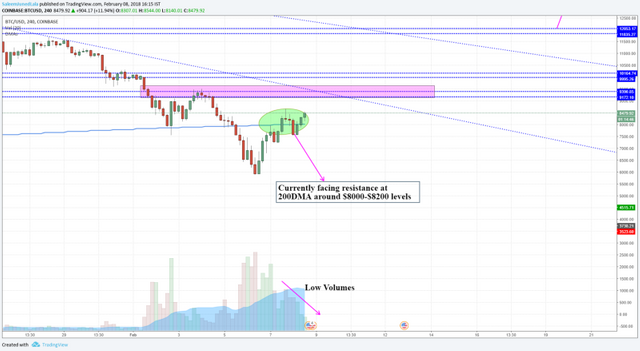
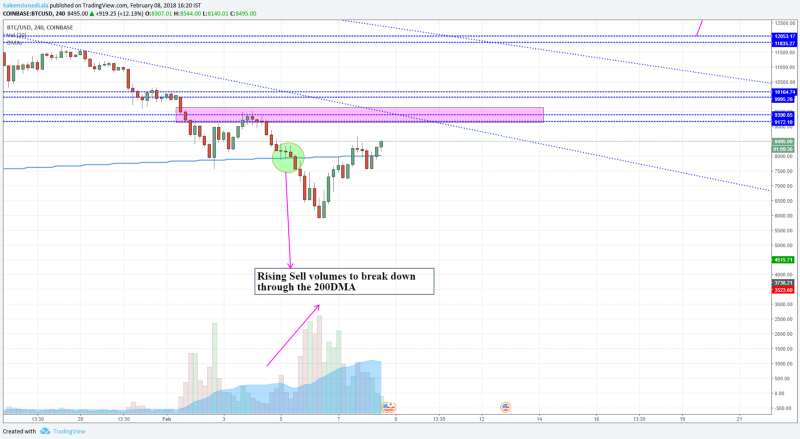
As you may notice from the chart above, the price action is currently congesting around the 200DMA. It does seem like we have breached it from below, but like I mentioned earlier, it’s a resistance zone and unless we clear it with some good strength, we are still being resisted from the 200DMA. As you may notice, the volumes with which we are trying to break through the 200DMA is low and is decreasing which in my opinion indicates weakness. Alternatively, the chart below shows the strength with which we broke down from the 200DMA considering the huge volumes.
What this means is that, unless we don’t break out above the 200DMA with some good volume & strength, we may come back down to visit the $6600-$7000 levels in my opinion.
Second Resistance- Horizontal Resistance with important Fibonacci Retracement Levels
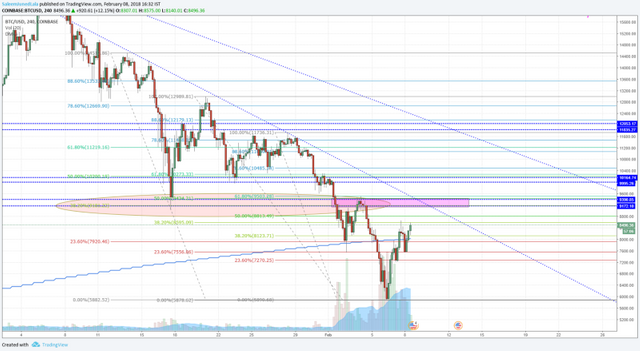
From the Chart above, you will notice that I have marked a region in red. This red price zone which falls between $9200-$9400 levels is a strong resistance level which had played not a major, but a significant role both as a support & Resistance when the bitcoin prices were around that zone in November. You may also notice that this zone was also a support region on 17th January, when the Bitcoin Price fell down only to retrace back higher from this level.
Resistance is an area where supply begins to be so high that it stops the price from further growth. It’s the level where sellers find the price so attractive that they sell heavily, therefore driving the prices down.
Along with this, we can also see that some important Fibonacci retracement levels coincide in the marked zone. Taking Fibonacci retracements from 3 previous swing highs to the low we created a couple of days ago around $5900 range, we get three vital Fibonacci reversal zones:
61.8% Retracement level from the $11,728 Swing High
50% Retracement level from the $12,992 Swing High
38.2% Retracement level from the $14,500 Swing High
The convergence of these various Fibonacci retracement levels in the marked zone which also happens to be a horizontal resistance level indicates that we may see strong selling pressure around the $9200-$9400 even if we manage to successfully breakout above the 200DMA. This could be profit booking from people who would have purchased around the $6000-$6500 levels for a swing trade and could also be the addition of more short positions from institutional traders who are bearish on the prospects of the Bitcoin prices.
Fibonacci Retracements are mathematical ratios used to identify potential reversal levels. These ratios are found in the Fibonacci sequence.
As such, this is the 2nd important resistance zone we need to break with strength before we go back higher.
Third Resistance- A Psychological Resistance zone with Important Fibonacci Retracements
Moving on to the Third Resistance level, I think it's important to mention that the market runs on 3 pillars- Fundamentals, Technicals & Sentiments. As much importance and relevance the Fundamentals & Technicals hold, we cannot discard the importance of sentiments as they indicate the greed, fear & emotional expectations of the market. More than often, you may hear a number of people, who are hardly invested in the market, or even if they have, mention a strong arbitrary number which they think would be the last stop for a price. A few days ago, when the Bitcoin prices started falling, the most commonly mentioned stop for the price was $10k. This is where sentiments came in, people, though probably not invested still have a view and this view is generally close to a whole number which may seem important to a particular stock or commodities value.
This sentiment is what forms the third resistance level for Bitcoins Bullish journey, creating a psychological resistance level at $10k levels. In my opinion, this level could be a major hurdle for us to cross as a number of people, who are usually never invested in Bitcoin would have purchased it at the low prices we are currently at, to sell off at an arbitrary target of $10k to make a quick buck from the swing. The closing of these long positions could create major selling pressure due to which the price may face some strong resistance around the $10k psychological mark.
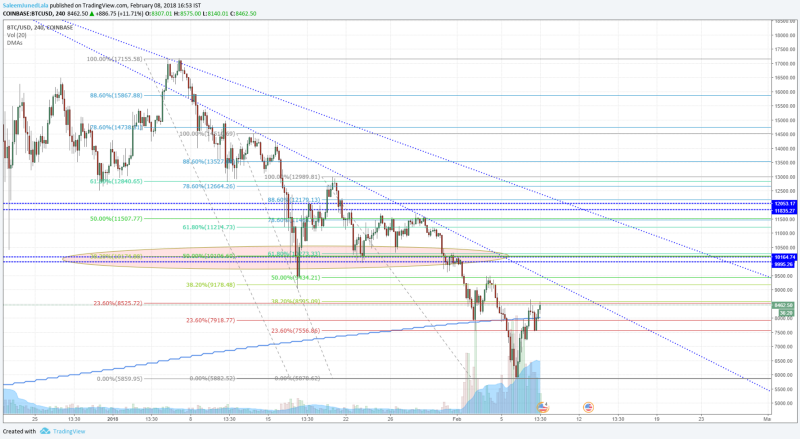
Add to this, we also have the convergence of some important Fibonacci retracements levels at the same mark when calculated from various swing highs to the recent swing low around the $5900 mark. These are:
61.8% Retracement level from $12,992 Swing High
50% Retracement level from $14,500 Swing High
38.2% Retracement level from $17,174 Swing High
Considering the above mentioned reasons, I expect to see some strong selling pressure around the $10k mark creating our Third Resistance zone.
Fourth Resistance- A Horizontal Resistance at the $11,850-$12,050 Mark
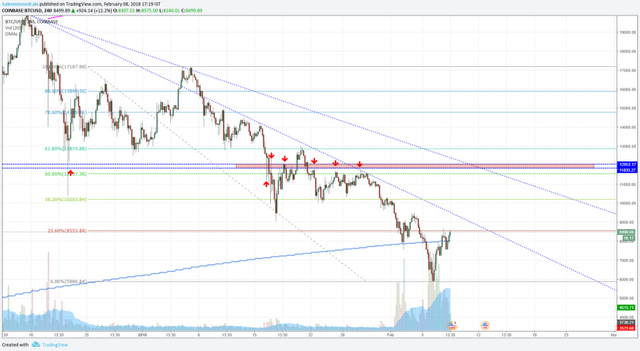
Reactions at the $11,850-$12,050 resistance level marked with arrows
Now that we may have crossed through the psychological level of $10k, the next hurdle on our way happens to be a little far off around the $12k mark. Sure, there is some other resistance on the way, but I think the $12k resistance is the more important and stronger one after the $10k mark.
As you may notice from the chart, the marked resistance level in red has played a significant role in the price action over the last couple of months, being both a support zone & a resistance zone. Add to this, this zone also falls between the 50% & 61.8% retracement level calculated from the swing high of $17,174 to the swing low of $5900. In the world of Fibonacci retracements for price action, the 61.8% zone is the most potential zone for reversals and its closeness to the marked resistance zone indicates that we may very well see some new short positions being added at this zone. Unless we squeeze these new short positions being placed by institutional traders (mostly), we may see some good retracement in prices from these levels.
Fifth Resistance- 2 Falling Trend-lines
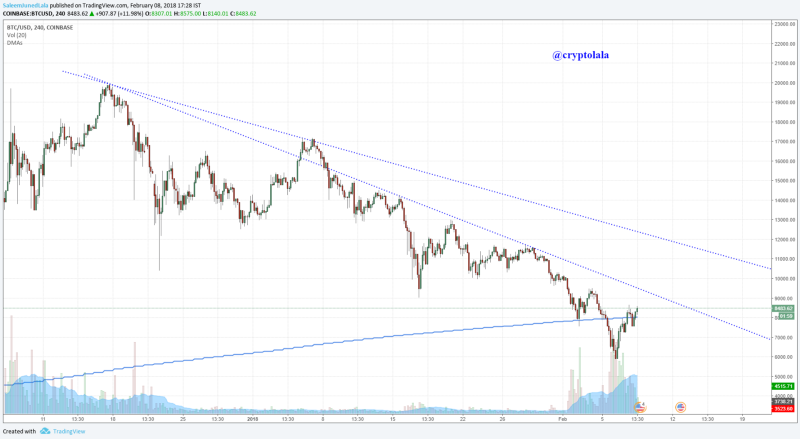
The 2 Falling Trend-lines marked in Blue on the Chart
This hurdle is not 5th in the order, but considering the vagueness on when it may come into play, I decided to write about it in the end.
In the chart above you may notice the 2 falling trend-lines that I have drawn using a blue line. You may notice that both these trend-lines have been respected well with the price having fallen down after having touched them. (Yes, the price did breach it once until it touched the next falling trend-lines. These technical drawings are rarely perfect, but are good indicators of what can be expected)
As such, we may see some resistance at these trend-lines, especially with the first one which gets closer and closer to the current price as time passes by. I expect these trend-lines to come into play at the following levels:
The first one may come into play soon around the $9,000-$9,300 levels
The Second one may come into play around the $10,250-$11,000 levels
Please Note: These falling trend-lines may come at levels before or after the ones I have mentioned. We can’t really give an exact price level for these as time also plays a significant role here.
Updates:
Update 1 (11th Feb): https://steemit.com/bitcoin/@saleemlala/road-to-the-moon-for-bitcoin-a-technical-perspective-update-1-11th-feb
In my opinion, once we break through the above 5 hurdles, we may go back into a sustained bull-phase again for Bitcoin. Until then, the dips would be a good place to buy more of Bitcoin for the long-run which is super bullish in my opinion.
P.S. Yes I know my chart color scheming skills are bad. I’m working on improving them and using better colors :P
Disclaimer: The views mentioned above are of my own and in no way an advice to anyone to invest based on these views. Please conduct your own research before making any trading decisions. You’re responsible for your own money.
Follow me on Twitter for more updates. https://twitter.com/saleemlala
If you agree with my views & benefit from them, make sure to upvote & resteem. Please leave your comments as well with any suggestions and views you may have.
$BTC $LTC $DASH $ZEC
#Crypto #Cryptocurrency https://t.co/WYtGk3RC2L
Disclaimer: I am just a bot trying to be helpful.