BTCUSD - Technical Analysis October 13, 2017 - Current Price $5581

BTCUSD
BTCUSD went for one heck of a run over the last week to $5800. In our previous analysis we were bullish BTC above $4760 and wow did it deliver. Having another look traders should be looking for a pullback and some price consolidation to take a position.
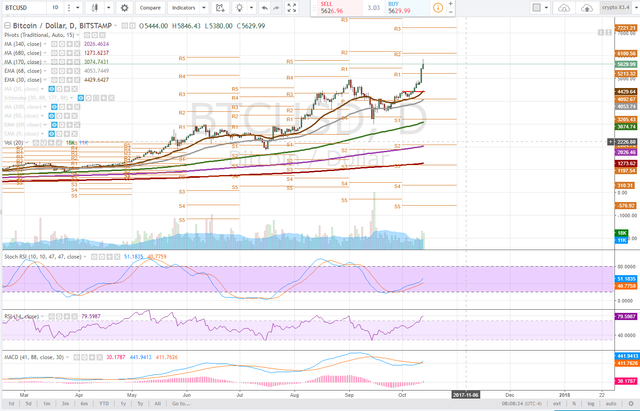
daily
On the daily time frame we are already observing some profit taking producing a reversal candlestick recognizable by the wicking. Looking at our stochastic RSI and MACD there is still plenty more room for some added momentum and we could be looking for a pivot back test of last weeks R1 pivot, $5213. The RSI on this timeframe has reached overbought and it is not unreasonable to see BTCUSD have such large swings.
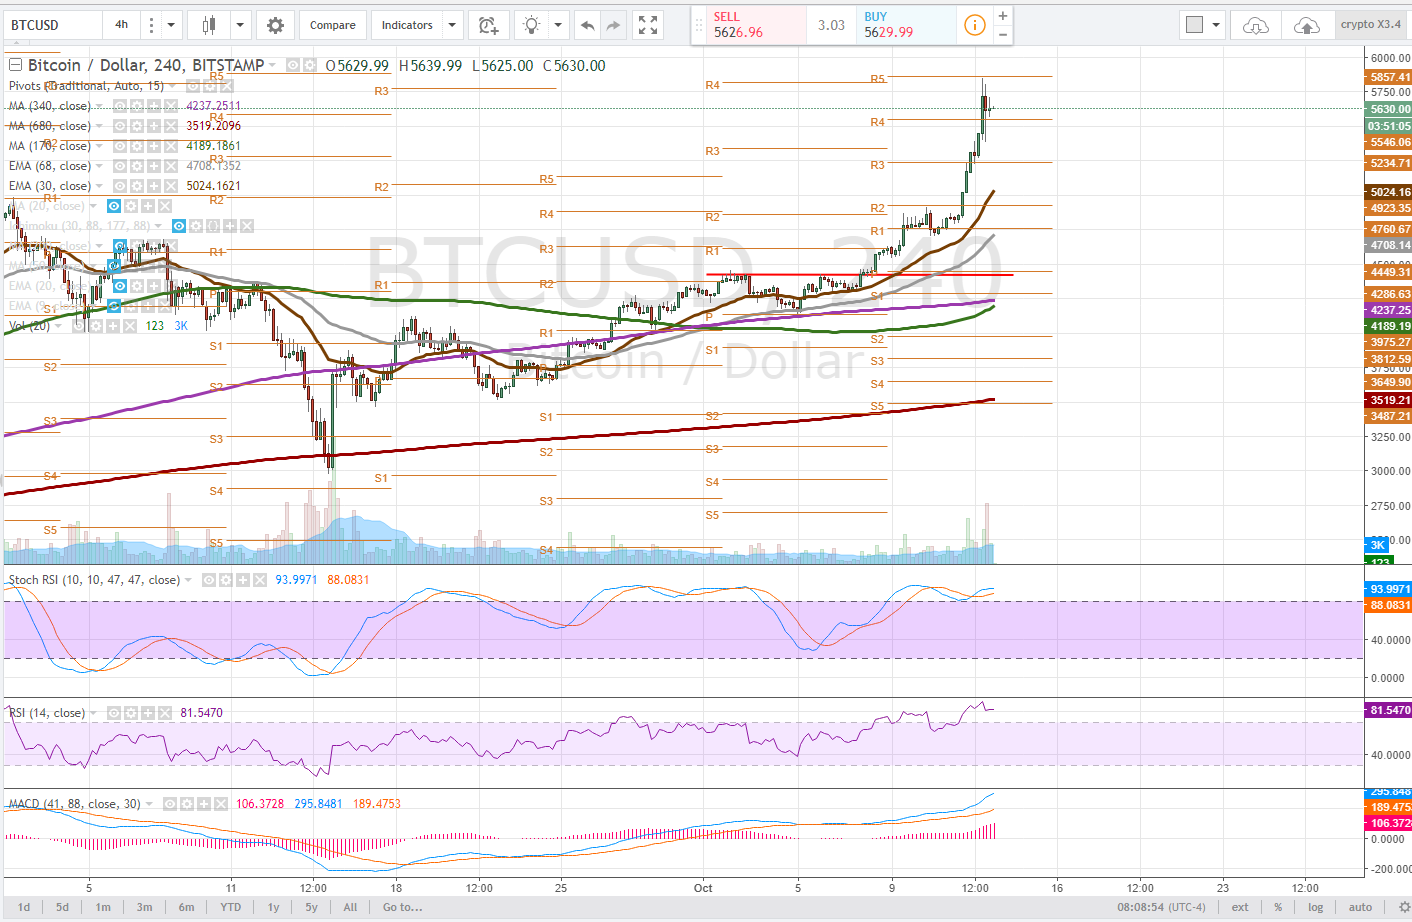
4 hour
The 4 hour time frame gives us a little more clarity with the price having rejected pivot R5 and pulling back all the way to pivot R4 where the price seems to be stabilizing and could produce for us a bull flag or other similar consolidation. This is how the chart stays healthy.
On the 4 hour time frame the RSI is extremely overbought as the STochastic is well within the uptrend range. We are looking for the RSI to normalize.
Notice the 170dma (green) is about to cross bullish above the 340dma (purple). Short above longer period moving averages is bullish and price above moving averages is a show of strength in price action.
While I expect some consolidation, BTCUSD bullish rallies can get pretty insane and a true pullback may never materialize, however, conventionally i would be looking for the EMA's to catch up to the price on this time frame.
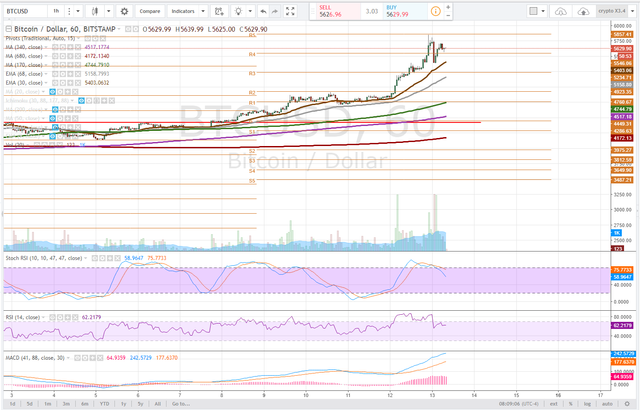
1 hour
The 1 hour time frame has already started to see its momentum indicators normalize and this is the time frame we should be watching to take a position. The RSI has fallen out of overbought and support has been found at R4 pivot with the 30ema not much further behind at $5400.
We are watching for the price to track along here and some buyers to come in and push the stochastic RSI back into uptrend. If the price loses the r4, $5546 we are looking for a test of the 30ema, $5403 and a possible a test of the 68ema, $5158.
Bullish Above: $5870
Bearish Below: $5320
RISK TRADE: Accumulate a long position here all the way to $5400. Use stop losses or be willing to take a loss if price loses 30ema. 1 hour time frame.
Don't forget to use stop losses!!!
Note that these ranges in dollar amounts seem vast, however, in percentage terms we are talking about 3% ranges in either direction. Swing traders position in anticipation of the next bull run. We only care about capturing the meat of the move. Consider with BTCGold fork coming up on October 25th, people may continue to accumulate BTC.
Previous Articles:
LTCUSD
XMRUSD
ETHUSD
NEOUSD
BTCUSD
DASHUSD
ZECUSD
Follow at your own risk, Not a financial adviser, understand the risks associated with trading and investing. Manage your own Risk - in other words you could lose it all and it's your own fault.

Bitcoin is crap I hope it will fail with all these hardforks.
Really starting to love these, learning loads! Thank you
Super glad if they do! Always feel free to ask questions ;-)
SAME! Satchmo always does an amazing job!
thanks for sharing keep it up
Thanks for sharing
very good analysis
Congratulations @satchmo! You have completed some achievement on Steemit and have been rewarded with new badge(s) :
Click on any badge to view your own Board of Honor on SteemitBoard.
For more information about SteemitBoard, click here
If you no longer want to receive notifications, reply to this comment with the word
STOPYour analysis just made my day