Daily Crypto News, 30th, August

Portugal Tax Authority: Bitcoin Trading and Payments Are Tax-Free;
3 Key Indicators Suggest Bitcoin Price Is Ready for a Massive Move;
US Banking Giant PNC Starts Using RippleNet for Cross-Border Payments;
Bitcoin ‘Failed Safe Haven Test’ After 7% Drop, Peter Schiff Gloats;
SBI Holdings’ Subsidiary to Pay Shareholders Dividends in XRP;
Welcome to the Daily Crypto News
Portugal Tax Authority: Bitcoin Trading and Payments Are Tax-Free
Portugal’s Tax Authority has clarified that both cryptocurrency trading and payments in crypto will not be taxed in the country, Cointelegraph en Español reported on Aug. 27.According to a report published on Aug. 26 by Portuguese business newspaper Jornal de Negócios, the Portuguese Tax and Customs Authority have confirmed that crypto transactions or payments are exempt from Value Added Tax (VAT).
The agency reportedly provided the clarification to a local crypto mining company, publishing an official ruling document. In the document, the authority states that the exchange of crypto for fiat money is free of VAT, adding that crypto users do not have to pay any income tax.
Portugal cites a 2015 ruling for crypto tax exempt
In the official statement, the Portuguese tax authority cited a 2015 ruling by the European Court of Justice regarding the case involving major Swedish Bitcoin (BTC) portal Bitcoin.se and its moderator David Hedqvist.
As reported at the time, the court ordered that Bitcoin is a means of payment and that the exchange should therefore be exempted VAT obligations. However, the Swedish Tax Agency subsequently argued against the ruling, claiming that the court did not fully understand the matter.
Earlier stance on crypto
The confirmation follows a previous tax ruling by the Portuguese tax authority that cryptocurrencies are not taxed in the country. A document published by the agency in 2016 states that income from the sale of crypto in Portugal is not subject to income tax.
Earlier in 2013, the central bank of Portugal, the Banco de Portugal issued a statement citing a 2012 crypto-related paper by the European Central Bank.
The Portuguese bank raised concerns over the ECB’s Bitcoin recognition as a “phenomenon of innovation in virtual currency models,” claiming that Bitcoin cannot be considered a safe currency as it its issued by unregulated entities.


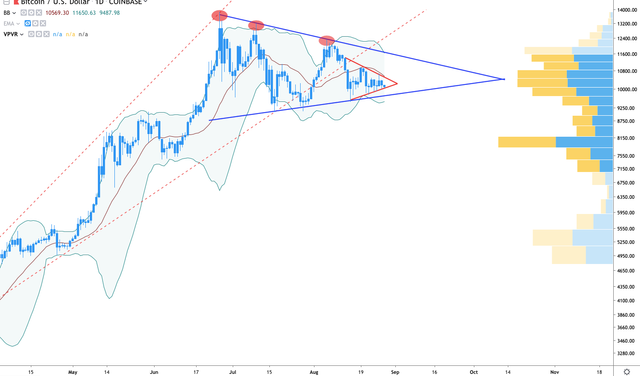
3 Key Indicators Suggest Bitcoin Price Is Ready for a Massive Move
Bitcoin (BTC) price has been everywhere and nowhere lately. As price consolidates analysts are concurrently screaming bull and bear. The noise is leading to confusion for the average investor who is finding it difficult to separate it from the signal.Let’s take a comprehensive view of Bitcon price action to gain clarity on the bullish and bearish scenario with special focus on three indicators: Crypto Fear & Greed Index, the Bitcoin Golden Ratio Multiplier and Bollinger Bands.
Is $10K the new $1K for Bitcoin price?
Earlier this month, popular Bitcoin market analyst PlanB tweeted that:
“Bitcoin’s 3 month struggle to break the magical $10k feels like begin 2017 struggle to break $1k...we all know what comes next.”
The same question appears to be on the minds of many investors and the uber bullish sentiment of the previous two months seems to be taking a hit as traders wonder:
- Why isn’t Bitcoin price exploding as the digital asset was supposed to function as a store-of-value hedge against market volatility?
- Why aren’t alts proving 100%+ gains to kick off a new alt season since Bitcoin is consolidating and slowly becoming bearish?
- Why haven’t we seen a slow roll rally right after the Bakkt announcement of its platform launch next month?
Up until January 2, 2017, Bitcoin had traded below $1,000 for 1,124 days. Once above $1,000, the following $1,000 hurdles were lept over at an ever-quickening pace. The number of days between $1,000 and $2,000 was reduced to 23. By the time Bitcoin price reached $5,000, the number of days it took to secure another $1,000 gain had dropped to 10.
As of right now, Bitcoin has spent the past 2 weeks in a struggle to stay above $10,000 and traders like PlanB are beginning to wonder if $10K is the new $1K.
More experienced traders familiar with Bitcoin’s trading history and character will advise calm. But that’s not enough to allay the worries of those who might have purchased Bitcoin from $12,900 to $11,500, especially if there’s a possibility that Bitcoin could enter a prolonged accumulation phase that will last until Q1 of 2020.
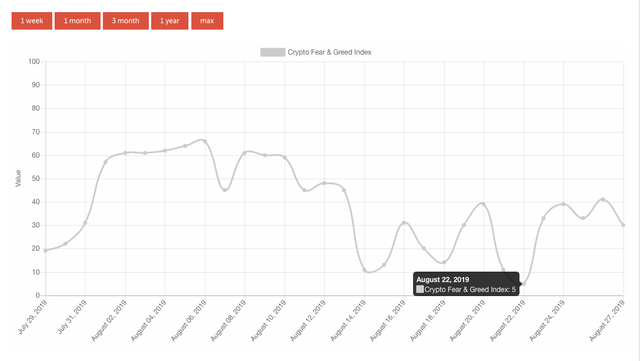
Crypto Fear and Greed Index at record lows
Sentiment has been proven to play a significant role in Bitcoin price action and PlanB is certainly onto something.
As previously reported by Cointelegraph, investor sentiment is measured by the Crypto Fear and Greed Index (CFGI) and multiple hedge funds, firms and crypto-analysts across the sector draw insight from the index.
The index maps investor sentiment on a scale of 1 to 100 where 1 represents investors' sense of doom and 100 reflects sheer optimism and greed.
According to the creators, a low reading tends to represent buying opportunities and high readings could be a sign that a correction is in store. As of August 22, the indicator had dropped to 5, the lowest level measured since December 2018.
Currently, the CFGI stands at 30 (fear), which is an improvement over last week’s reading of 11 (extreme fear).Given that BTC/USD has plotted lower highs and lower lows as volume dries up and the trading range tightens near the all-important $10K mark, it seems sensible to infer that traders are growing increasingly reluctant to take a position as many are afraid support at $10k will finally give and eventually lead to a new local low below $9,000.
It takes more than just a hunch
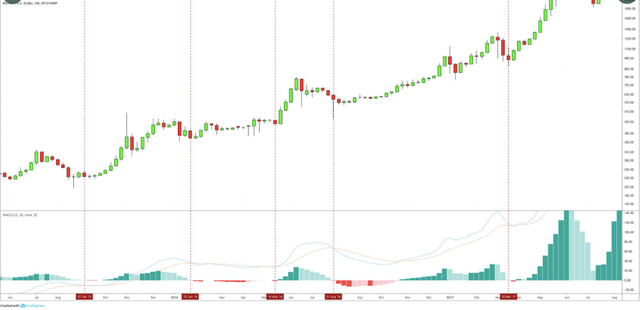
Obviously, sentiment is not the singular driver of any asset’s price action and some discussion of Bitcoin’s technical setup and current market structure is required.
On the weekly time frame, one can see that the Moving Average Confluence Divergence (MACD) indicator plotted a > bearish crossover for the first time since the bottom was reached in February 2018 and the MACD crossed bullish.The MACD (blue) crossed below the signal line (red) over the weekend and dipped below 0 (baseline). One can also see that the histogram has turned negative and dipped into what could be interpreted as bearish territory. It should be noted that the MACD is a lagging indicator that does not accurately reflect an asset’s current price action.
Some traders such as Murad Mahmudov will rely on this point to invalidate a conclusion suggesting that Bitcoin has lost momentum and turned bearish. Over the weekend Mahmudov tweeted:
“People out here be talking about the Weekly MACD ‘bear cross’ like it’s some kind of doom verdict. Ironically it marked the local bottom every single time during the last bull cycle.”
After posting the above chart to support his argument, Mahmudov said:“I repeat for the last time. This is a BULL market.”
While we are less confident about speaking in absolutes — especially given Bitcoin’s tendency to go against analyst’s interpretations and rip investors' shirts off — it is worthwhile to consider bullish and bearish possibilities in order to make wise decisions and have a gameplan in case a trade goes belly up.
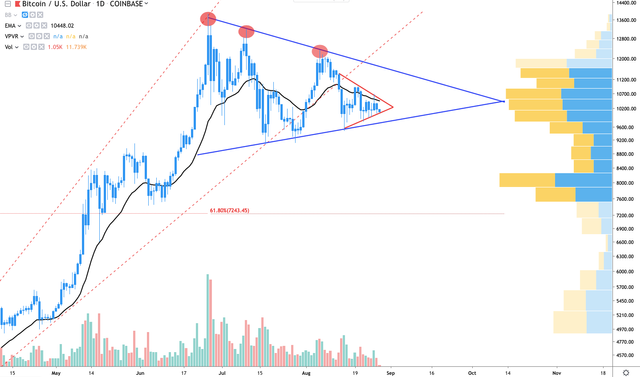
Bollinger Bands are tightening
Over the short-term, data from the daily Volume Profile Visible Range (VPVR) suggests BTC could drop to 8,750 to $7,500. The $7,500 level is a short distance away from the 61.8% Fibonacci retracement level at $7,250. A number of analysts have stressed the importance of the 61.8% fib retracement level, especially after assets correct from a parabolic advance.
Sell volume is outpacing purchasing volume on the daily and 4-hour chart but overall volume is drawing down and the Bollinger bands are tightening. This usually happens before Bitcoin price makes a sharp move.
Meanwhile, Bitcoin continues to consolidate within a symmetrical triangle and a bull break could see BTC set daily higher high at $11,400 followed by an attempt at $11,790, which aligns with the upper arm of the larger bull pennant.Golden Ratio Multiplier suggests accumulation in full swing
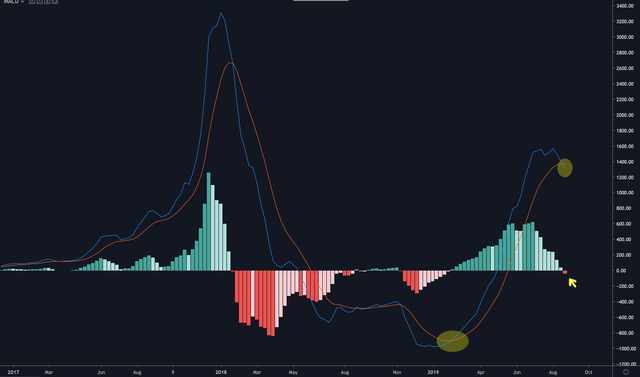
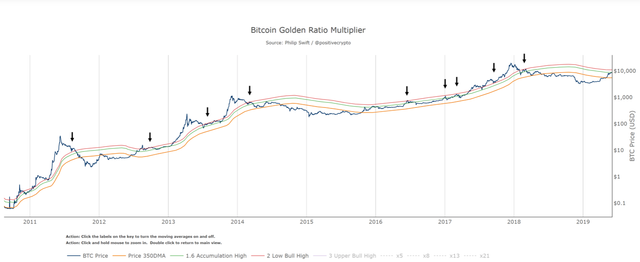
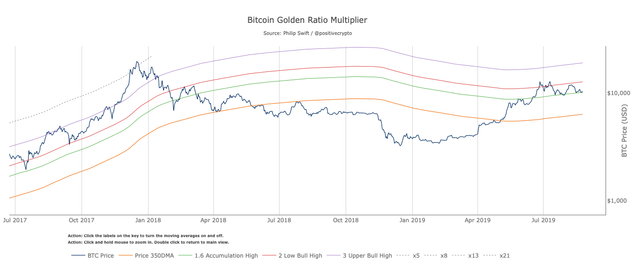
A more comprehensive indicator to use when assessing Bitcoin’s maco market structure and price action is Philip Swift’s Golden Ratio Multiplier. The tool tracks Bitcoin’s long-term price action along the 350 daily moving average, then multiplies the 350 DMA by the golden ratio (1.68) and numbers in the Fibonacci sequence (1,2,3,5,8,13,21).
According to Swift, the Golden Ratio Multiplier achieves the following:
- Accurately and consistently highlights intra-cycle highs and lows for Bitcoin price;
- Picks out every market cycle top in Bitcoin’s history;
- Forecasts when BTC/USD will top out in the coming market cycle.
Currently, Bitcoin is pinned beneath the green (350DMA x 1.6) and red (350DMA x 2) averages with red representing a “low bull” phase and green standing for “accumulation.” Given that BTC is trading near $10,200 and riding along the green line at the time of writing, the indicator suggests that Bitcoin is still in an accumulation phase.
Historically the red (350 DMA x 2) average has functioned as a good point to take profit and most recently the tool called the $13,800 and $12,900 M top for Bitcoin.The Golden Ratio Multiplier seems well suited to momentum (swing) traders who prefer not to stare at charts day-trading all day.
According to Swift:
“Using three moving average lines (350DMA x 1.6, X2, X3) has allowed us to pick out almost every single intra-cycle price high in Bitcoin’s history.”
Indicators converging on the Bakkt launch date
Taking a quick glance at Bitcoin’s daily chart, 4-hr and 1-hr chart and one will see a procession of bull pennants (symmetrical triangles) and ascending wedges in all variety of sizes. At the moment Bitcoin trades within a massive pennant extending from the June 26, 2019-high at $13,800 until the current price near $10,000.
Interestingly, following the triangle arms to their convergence point brings one to September 23, the same day Bakkt officially launches.
Bitcoin price neatly consolidates within the symmetrical triangle and if one takes time to zoom in on the 4-hour and 1-hr time frame, they will find breakouts and breakdowns have been the result of smaller bull pennants and bearish ascending wedges.The second pennant within a pennant that we will focus on extends from $11,500 until the current price at $10,115. Consolidation within the triangle is just as neat as its larger counterpart and traders anticipate a strong move as BTC price narrows toward the triangle vertex.
Coincidentally, the termination of this pennant aligns with the current state of indecision within the market from a technical and sentiment-based point of view. Bitcoin is on the verge of doing something big, but it is difficult to calculate whether the move will be bullish or bearish.
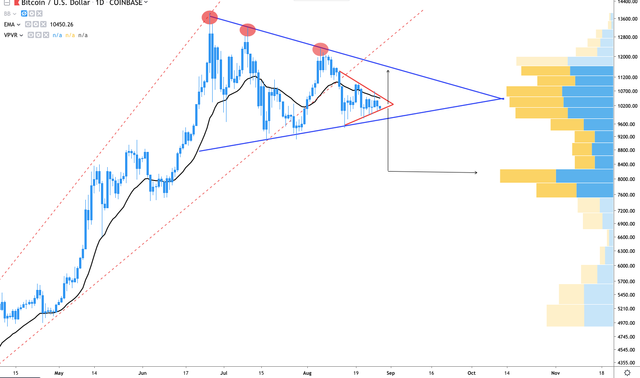
Bullish scenario
A bullish scenario could see Bitcoin price drop to lower triangle arm ($9,685), which is closely aligned with the lower arm of the Bollinger band indicator at $9,500.
An oversold bounce and purchasing volume from this point could see Bitcoin begin its journey back to the 20-MA of the BB ($10,570) and an encouraging move above this point would see Bitcoin set a daily higher high at $11,400 which is close to the upper arm of the BB indicator.
Extending a tad bit further would allow Bitcoin to touch the upper arm of the symmetrical triangle.
Bearish scenario
A bearish move would see Bitcoin price drop from the pennant, below the lower BB arm (below $9,500).
The VPVR shows a lack of buyer demand in this zone and this suggests that a dip below $9,500-9,100 could bring BTC below the 61.8% Fib retracement for a possible oversold bounce near $8,200.
Barring a reversal at this juncture, BTC could then drop to the next demand zone at $8,000 to $7,650.
3 key indicators to consider
Of course, no man has a working crystal ball. But referring to the Crypto Fear & Greed Index, the Bitcoin Golden Ratio Multiplier and Bollinger Bands to analyze the market on multiple time frames does assist with anticipating the direction of the next move.
Technical analysis is merely a guide, not a fortune-telling method. It’s the duty of each investor to conduct their own research and determine which choice is most appropriate for their appetite for risk.
US Banking Giant PNC Starts Using RippleNet for Cross-Border Payments
PNC — the United States’ eighth-largest bank, with almost $400 billion in assets — has become the country’s first to start using the RippleNet blockchain network for cross-border payments.Fintech Futures reported on Aug. 29 that PNC Treasury Management is now offering RippleNet-based cross-border payments solutions to its commercial clients, claiming that the blockchain solution will give them:
“The ability to receive a payment from an overseas buyer against their invoices instantly, transforming the way they manage their global account receivables and allowing them to better manage their working capital.”
Ripple: MoneyGram partnership bearing fruit
As reported, PNC had first revealed its plans to use RippleNet — and specifically, Ripple’s liquidity product xCurrent — back in September 2018.
At the time, the announcement caused the value of Ripple’s digital token XRP to soar.
At the time of writing, XRP is not seeing a price boost: in keeping with the wider crypto market, the asset is firmly in the red, trading down by around 6% on the day.
Yet as Ripple’s head of Global Institutional Markets, Breanne M. Madigan this week indicated — price is not the only parameter company insiders are eyeing.
Madigan shared fresh data on Aug. 23 that revealed that while overall XRP trading volume was down nearly 65%, XRP/MXN volumes on Mexican crypto exchange Bitcoin surged by over 25% during the same period of time that MoneyGram payments into Mexico using XRP went live.
Madigan said the data is a sign of a real use case driving real volume.
In June, Ripple had announced its purchase a 10% stake in MoneyGram — the second-largest remittances firm worldwide —as part of a $30 million partnership with the entity. A central stipulation in the deal was that MoneyGram would begin using xRapid.
Ripple CEO Brad Garlinghouse later claimed that a year from now, the MoneyGram deal “will have a more consequential impact on the crypto markets than the Libra white paper.”
Backlash from XRP holders
This week, Garlinghouse has been prompted to comment on several controversies surrounding the Ripple project. Among them is some token holders’ continuing frustration about what they perceive to be the negative market consequences of Ripple selling XRP to its clients.
In parallel, an ongoing class action suit against Ripple has been recently amended, in which a disgruntled investor has alleged that the firm sold XRP as an unregistered security in violation of federal law.

Bitcoin ‘Failed Safe Haven Test’ After 7% Drop, Peter Schiff Gloats
Bitcoin (BTC) has shown it is not a safe haven asset, gold bug Peter Schiff has said after the largest cryptocurrency dropped 7% in daily trading.In a tweet on Aug. 28, Schiff, who has become increasingly known as a Bitcoin naysayer, claimed BTC/USD dipping below $10,000 once again on Thursday put pay to theories it functioned as a hedge against fiat volatility.
Schiff: Bitcoin “failed safe haven test”
“Bitcoin has again failed the safe haven test. On Friday, as escalating trade tensions sent global stock markets plunging, investors sought refuge in monetary safe havens. The Japanese yen, Swiss franc, and especially gold all moved higher. Yet Bitcoin plunged by more than stocks!” he wrote.
Schiff was referencing a popular theory about Bitcoin investment habits which has surfaced over the past two months.
Against the background of the United States-China trade war, tensions in Venezuela and unrest in Hong Kong, commentators declared Bitcoin offered an option to preserve wealth for those in affected regions.
As Cointelegraph noted, overall Bitcoin network volatility hit new two-month lows last week.
Now, however, the fresh move down spurred critics such as Schiff, who continued:
“Since last Thursday Bitcoin has lost more value than any of the major stock market indexes, while gold and silver have gone up.”
Already REKT?
His argument, however, was lost on Bitcoin proponents. Responding, the Twitter account known as Parabolic Trav rebutted Schiff on Bitcoin’s intrinsic value.
“Why on earth would Bitcoin be a safe haven? Bonds are the safe haven in the current paradigm. Nor is gold a safe haven,” he wrote.
The bonds comments came as the U.S. Treasury Secretary, Steven Mnuchin, revealed the government was considering ultra-long bonds of 50 or 100 years.
In an event which could have contributed to Bitcoin’s fall, issuance of such bonds would decrease borrowing costs for Washington and limit taxpayer exposure to the U.S.’s almost trillion-dollar annual budget deficit.
“Bitcoin is simply, over time, ‘number go up,’” Trav meanwhile continued in an attempt to deflate Schiff. He concluded:
“If you try to fit it into the legacy financial analysis box, you'll be rekt Which is what you are Pete!”

SBI Holdings’ Subsidiary to Pay Shareholders Dividends in XRP
On Aug. 29, MorningStar Japan, a subsidiary of financial services giant SBI Holdings, announced that it will offer its shareholders dividends in the form of XRP tokens.According to the statement, the Japanese company will offer 30 XRP to its shareholders if they hold a minimum of 100 shares by Sept. 30.
Shareholders will receive 30 XRP
It is noted that shareholders who are eligible to receive 30 coins of the world’s third largest cryptocurrency by its market capitalization will have to open an account with cryptocurrency exchange SBI VC Trade.
At press time, 30 XRP are worth around $7.50, with one XRP coin currently trading at $0.25, according to Coin360.
As Cointelegraph reported in May, SBI Ripple Asia announced the launch of a store settlement service affiliated with SBI Holdings and Ripple’s co-developed XRP-powered payments app MoneyTap.