PRICE ANALYSIS, JAN. 19: BITCOIN, ETHEREUM, BITCOIN CASH, RIPPLE, IOTA, LITECOIN, NEM, CARDANO

After a sharp fall, the aggressive bulls jump in and buy at lower levels. This strategy has resulted in huge gains for the cryptocurrency traders in 2017. However, unlike previous occasions, we have not seen a sharp rise this time. This shows that the traders are not confident of a huge rally from the current prices.
In the next few days, we expect a range bound action in most of the top cryptocurrencies.
BTC/USD
We had expected a pullback from the $10,704.99 levels. But Bitcoin overshot on the downside and fell to $9,300 levels.
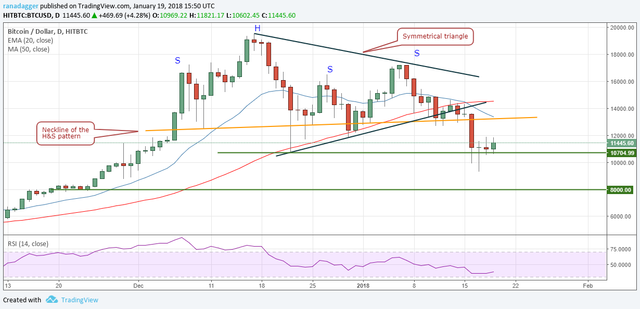
Currently, the bulls are attempting a reversal, which is likely to carry the cryptocurrency to the neckline of the head and shoulders pattern at $13,202 levels.
We expect another round of selling from those levels, which is likely to sink the BTC/USD pair back to the support zone of $10,704.99 to $9,300. If this support zone breaks, a fall below $8,000 is likely.
On the other hand, if the bulls succeed in holding the support zone, it will lead to a start of a new uptrend. Nimble-footed traders can play the rise, but others should wait for more clarity to develop.
ETH/USD
We expected the support zone between the trendline and $940 to hold. On Jan. 17, Ethereum broke below the trendline and fell to a low of $770.
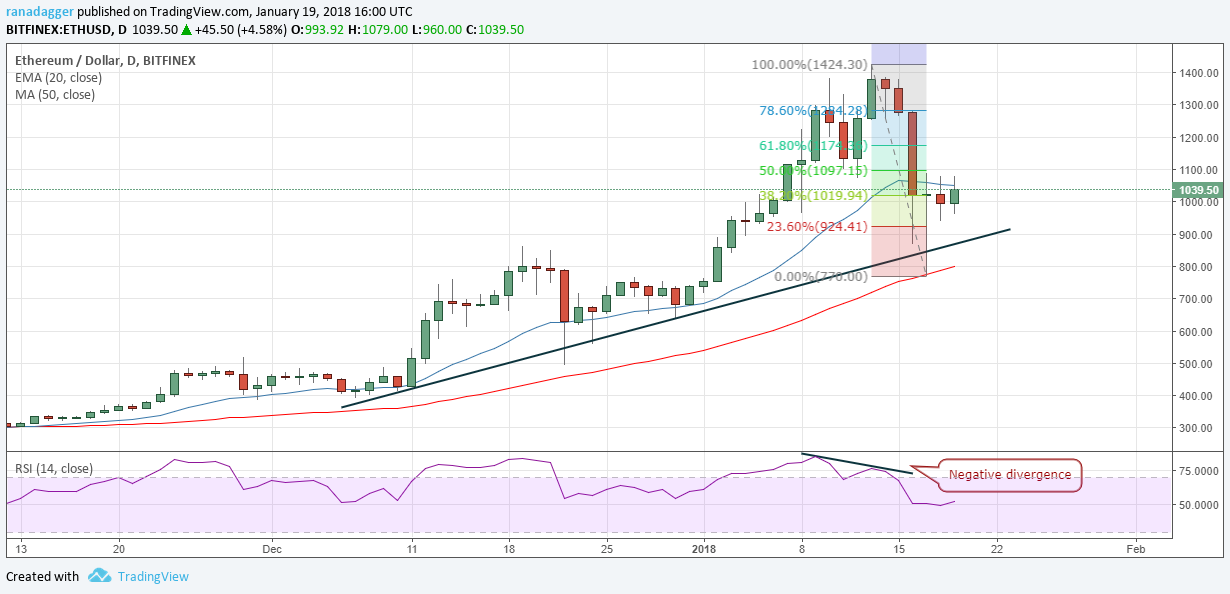
The bulls bought the dip aggressively, which has resulted in a pullback that carried the cryptocurrency towards the 50 percent Fibonacci retracement levels of the recent fall from $1424 to $770.
For the past three days, the ETH/USD pair has been struggling to cross above $1097. If the price breaks out of the $1100 levels, we expect a move to $1174.36 and $1284.28 levels. As the stop loss is $930, which doesn’t offer a good risk to reward ratio, we are not suggesting any trade on it.
BCH/USD
We expected the $1733 levels to hold. Still, the bears easily broke through it and Bitcoin Cash fell to a low of $1364.96 on Jan. 18.
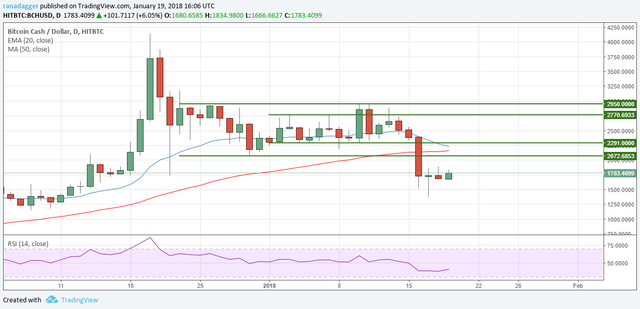
The current increase is likely to face resistance at the $2072 levels, which was the support of the range previously. We shall get a confirmation of a bottom during the next downturn. If $1364.96 breaks, a fall to $1194 is likely.
Our bearish view will be invalidated if the BCH/USD pair sustains above $2072 for a day.
XRP/USD
We had forecast a fall to 61.8 percent Fibonacci retracement levels of the latest rally, however, Ripple fell close to the 78.6 percent retracement levels, which coincided with the lower end of the descending channel.
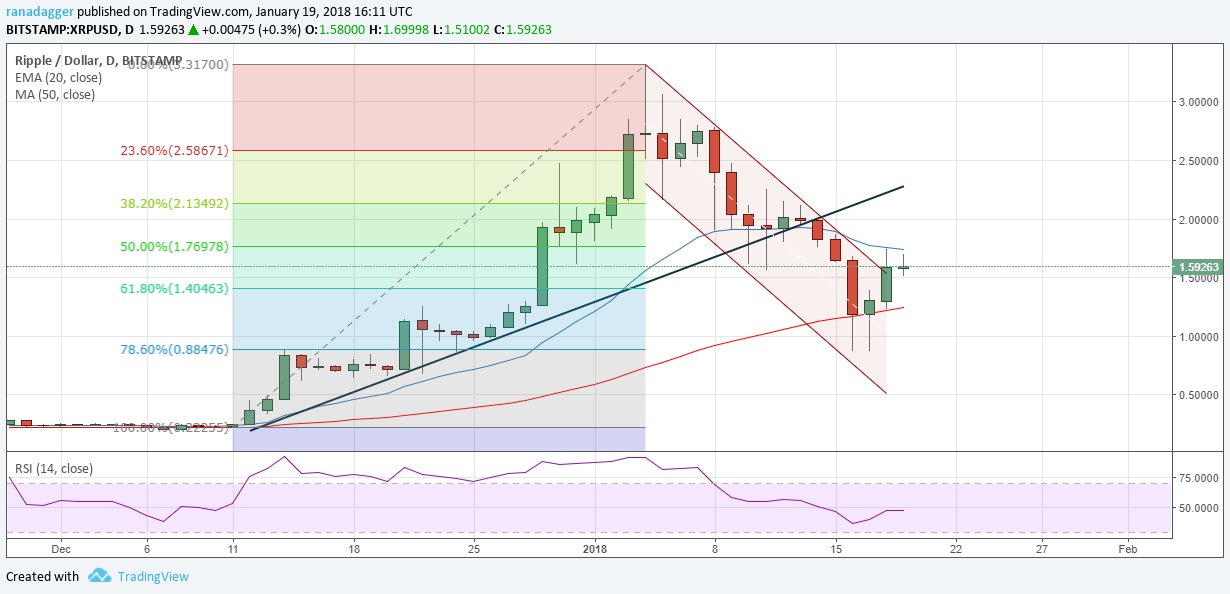
The cryptocurrency has broken out of the descending channel, which suggests that the downtrend is over. However, the present increase is facing resistance at the 20-day EMA, above which a move to $2.20 is likely. At that price, the XRP/USD pair will face resistance from the trendline that had previously acted as a strong support.
However, if the cryptocurrency fails to break above the 20-day EMA, the bears will attempt to resume the downtrend. Support lies at $0.87.
We expect a few days of range bound trading.
IOTA/USD
IOTA broke down of the bearish descending triangle pattern on January 16, which gives it a pattern target of $1.10.
The ADA/BTC pair broke out of the downtrend line yesterday, Jan. 18, however, it could not pick up momentum. It is struggling to rally above 0.00006. Once bulls breakout of 0.00006, a move to 0.00007 and thereafter to the 0.00008 levels is likely.
The cryptocurrency pair will become negative below 0.00004730.
FOR MORE JOIN MY TWITTER:- https://twitter.com/Ali_shehbaz
TELEGRAM:- https://t.me/cryptophobiaa
FACEBOOK:- https://www.facebook.com/cryptophobic