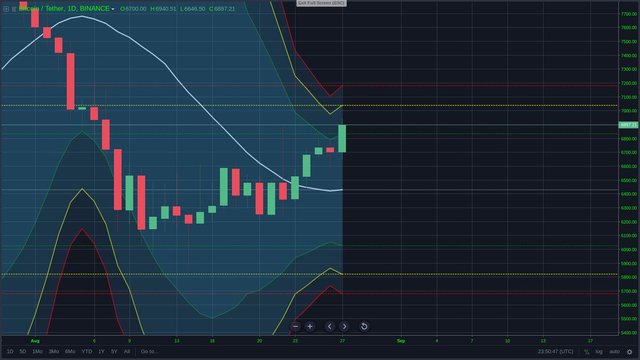
1D CHART
1.As we can see btc almost reach yellow line of upper bolinger bands 7000$
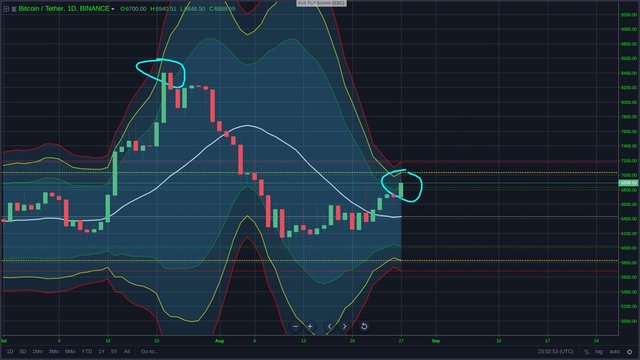
2.second image you can see what happend last time when btc almost reach upper yellow line of my custom bolinger.
Legal Disclaimer: I am not a financial advisor nor is any content in this article presented as financial advice. The information provided in this blog post and any other posts that I make and any accompanying material is only my personal thought.It should not be considered financial or investment advice of any kind.I only want to share my thought with you.
With respect's Crypto Rado