[0240] - A 'Forensic Analysis' of the Current Bitcoin Price

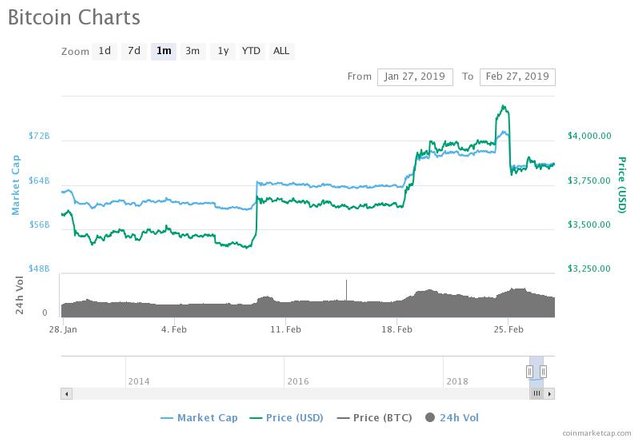
On Feb 9th, 2019, the price of Bitcoin spiked. It rose again on Feb 18th and then dumped hard on Feb 25th, leaving the crypto community wondering. What happened?
The Psychology of Trading
When I look at the charts, I don't see price. I see psychology. The rise and fall of the bitcoin charts, to me, is really a thought pattern. A historical snapshot of what traders thought at the time they made trades.
I look at charts this way because my work revolves around psychology, human emotion and what people think. For the last 20 years people basically hire me to 'iron out their thinking'. Whether it be in their relationships or in developing products for their company.
After years of listening to people, I can spot problem thinking just like a musician can spot a bum note when it's played.
So, when I came into crypto mid 2017 and started looking at charts, I couldn't help but look at them as a psychological blip. A pulse of thought. A waveform of emotion.
It made sense to me to look at the charts that way because, after all, they represent human trading actions which can be traced back to a thought that caused it.
Technical Analysis Without Psychology Is Just Lines & Triangles
Like everyone else, the longer you trade crypto, the more you learn. When I came across technical analysis (TA), I was really interested in the approach to charting because it was an attempt to interpret the patterns found on the chart. An attempt to create an 'alphabet' from the peaks, dips and repeat patterns. With the aim to understand what the charts are saying.
As this was similar to my own work in natural medicine, I could see the logic. From my own studies, human emotions run in cycles and are not just one-off, random events. There is always a story, a progression into and out of a feeling state. I.e. You don't go from sadness to joy in one step but need to transition out of a feeling state and into the next.
This applies to trading and the chart patterns. They are progressions and there is indeed a language you can interpret. But to read it, you have to forget about price. Price is a distraction. It stops you from seeing what people are thinking about the price.
But I digress, I was talking about technical analysis. There are some real pro's out there who do this. Then there are a lot of crypto traders who draw lines and triangles and at the end of it all are still unclear what the market is doing. The amount of times I have watched convincing chart presentations only to find that the person is completely in the dark and using TA to seem intellectual is common.
TA is good. But only when you link it to the way human beings think and respond emotionally. TA without psychology is just lines and triangles. Noise.
( Really ) Reading the Charts
Now that I have covered the psycho-babble, I want to talk about the Bitcoin charts. If you look at the time period between Feb 9th, 2019 and Feb 25th, you can almost see what people were thinking. While what I am about to say is inexact, it does give you a good start to interpreting the charts.
Let's look at what happened. And break it down.
Stage 1: The Price Spike on Feb 9
When I saw the massive buy wall on Feb 9, it was pretty obvious what had happened. Someone with a lot of money moved the market. A big buy order was placed and 'slippage' occurred.
While this is obvious, if you dig a little deeper, there is more information to be had.
Someone with a lot of money caused the sudden price spike. That we know. But the thing is, anyone with millions of dollars to spend is most likely a professional trader. Meaning they know that a huge buy order would cause the market to move.
So the question you have to ask is, "why didn't they buy OTC"? Over the counter and off the books?
When I see a buy wall like that, I think to myself that this is someone who (a) is planning to take profits and (b) wants the trade to be public. They wanted retail ( noobs ) traders to see the price move. In other words, the Feb 9 trade and market spike was bait. It was a move designed to draw retail money in to drive the price of Bitcoin even higher.
As soon as I saw the buy wall on Feb 9, I knew that within the next 2 weeks, they would sell, take profits and the market would revert back to where it was. I.e. It would dump hard.
Stage 2: The FOMO Rally on Feb 19th
After the initial shock move of the market, the crypto market moved sideways. Presumably ambivalent and wondering whether it would continue to rise or fall. At a guess.
Then the market moved higher on Feb 19th.
While I am unsure why it did ( I won't lie ) and am not as certain as the Feb 9 move, I largely think it was due to false enthusiasm and 'retail starvation' after a long bear market. I.e. People desperately wanted the price to rise and when it did on Feb 9 because of the whale, everyone bought into the signal. Even though the market was in fact, completely unstable.
After all, Feb 9 was not organic growth. It was fast growth, for no reason other than someone with a truck load of money bought a bunch of Bitcoin. It's wasn't because of positive news. It was because of an isolated groups of trades, not a broad movement.
So, I read Feb 19 as a delayed reaction of false enthusiasm to Feb 9. I.e. Retail investors were banking on a higher move and FOMO had set in that this was "the bull run". Again, this is a rough sketch. It's an inexact interpretation. I would need to see this play out a few dozen times to nail it down so don't burn me if I'm out.
Stage 3: Profit Taking on Feb 23
Now, Feb 23 is interesting. At first glance, the Bitcoin market dumped hard. When I saw this, I was not surprised. In fact it was predictable based on what I had previously thought.
Feb 23 was profit taking. The whale took profits.
To most crypto traders, taking a 10%-20% profit is like taking a loss against the 100x's that can be had. However, in traditional trading of stocks and bonds, they usually aim for a 5-7% return. In those markets, 5% is a win.
Which leads me to think that the market move from Feb 9 to 23 was indeed performed by someone with Wall St experience. Happy to make 10% returns in 2 weeks. Given the amount of money, that's a pretty hefty profit for clicking a few mouse buttons.
In my mind, someone with professional trading experience was 'testing the market'. The fact that the trade was public for all green, retail investors to see tells me that this was to test 'taking candy from a baby'.
Double Jeopardy
So what comes next? That is the eternal question in trading. What's beyond the right side of the chart?
If I am ( somewhat ) right in my interpretation, you can predict some outcomes based upon the line of logic. The market rose sharply, retail investors FOMO'd in, the market dumped suddenly.
Now we are in an 'ambivalent' period again. The sideways movement is not an isolated event. It's a delayed reaction to what happened previously.
When you look at the declining trading volume and a price that is straining to move higher, I tend to think that the market is about to dump for a second time.
The reason is that there are mixed feelings. You have two camps.
- Retail investors who get what happened, realize that the big whale 'took profits' and exited their position. So a percentage of the market will follow suit.
- The investors who "want the price to go higher" because they emotionally "want the bear market to be finally over" will HODL ( as always ). And hold while the momentum is to the downside.
I may be wrong but the market is a house of cards, for reasons of psychology. I.e. This was a false move higher and had nothing real to support it.
Wrap Up
In the remote chance my forensic analysis is true, it all boils down to one thing. The sentiment in the crypto market is currently in capitulation and is starving for gains. Meaning, there is no real enthusiasm in the retail market and won't be for some time yet.
The market will move higher, but that will be over a span of 6 to 12 months. Not from 20 minutes of whale trading on Feb 9. The market will move though stages that will take weeks. Emotional cycles as it builds towards a strong enthusiasm or 'bull run'. Most likely in 2020.
The Good News
The question is after all this psycho-babble, guess work is this? When moon?
The next bull run will be insane and dwarf the previous one by a massive scale. The infrastructure has been built to support a bigger market. Bigger money is waiting to enter and when it does, the floodgates will drive price higher across the board.
The crypto market of late 2017 will pale in comparison.
In the meanwhile, I will continue to read the markets and look at the price movement in terms of how human beings think. And react emotionally. I haven't got it down to an art form yet, but events like the one in this post provide a solid example I can work off.
The markets are not price, people. They are what people think.
Thanks for watching,
Brendan Rohan - Indie developer of 'next gen' natural medicine from Melbourne, Australia
Www.Skyflowers.co ( see "botany" tab for the plant research )
Www.ClinicalFlowerTherapy.com
Social @iSkyflowers
YouTube Skyflowers.Tv
If you support natural medicine and an independent research project that began in 1997, then steem me. The creds I get will help me provide a solid body of information that future generations can build upon.
DISCLAIMER: This article and all information on this channel & all content is offered purely for educational & entertainment purposes. Always do your own research when investing money and seek the help of a registered financial advisor.