[0249] Is the Bitcoin Price Spike Signalling A... Downtrend?

Bitcoins 25% rally is the talk of the interwebs. People are rejoicing like it's the end of world war 2. People are cheering. The champagne is flowing.
While a giant green candle is a good sign of future gains, I know enough about crypto now to keep my head screwed on and look sideways before I step off the curb.
I ( and many others ) have been predicting a downtrend for some time and to be honest this upspike in price tells me one thing. The market is highly unstable right now. Which ain't always a positive thing!
While crypto Twitter is ablaze with high fives and moonshot memes, I can't help but think that this is that eery moment when you're at the beach and you see all the sea water being sucked out to sea, leaving fish flapping on the sea bed.
Personally, I'm turning away from the spectacle and bracing for a tsunami. A downward tsunami.
Don't call me a kill joy, it's just what I see. A short term bear trend into a long term bull run of epic proportions. But, I'm sober that my perspective is just a perspective. A guess. A speculative dice roll.
So, erring on the side of the fact I may be wrong, I took to the interwebs to look at other peoples views.
Interestingly, I came across this gem from 2017. If this dude knew how right they were, they'd flip their wig. What a call about the 2018 market!
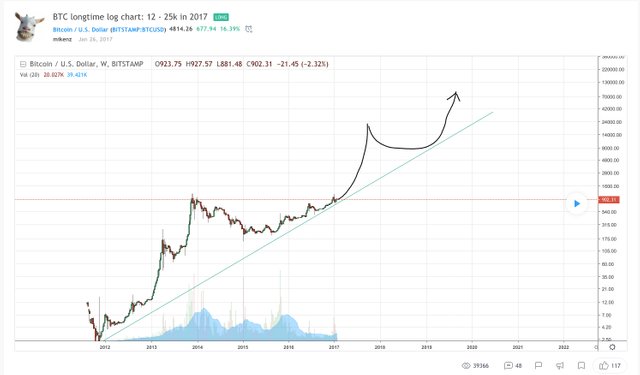
The thing about this chart is that it is the bitcoin logarithmic chart, not the standard crappy linear chart that you get on CoinMartketCap, etc.
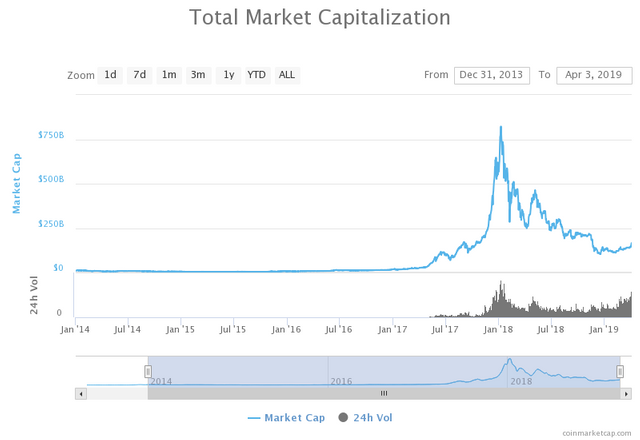
Which shows you none of the previous bull runs nor the fact they look like carbon copies of each other. A fractal pattern repeating upwards, with more and more dollars each time.
The only real difference is that the time length to inflate a bull market and deflate into a bear bottom is slightly longer each market cycle. This is due to the fact more money needs to flow into and then out of the market, which takes a little more time each market cycle.
Hence the long, drawn out bear market.
The silver lining is that the next bull run, theoretically, should last longer. With a slightly longer euphoria phase at the peak. Thus giving you and me a little extra time to sell the top and exit the crypto market with bags of cash to buy a Tesla and inject the spare change into other markets that have bottomed out.
Such as the housing market, which should be ripe for the picking buy then.
Let's get back to the logarithmic chart and do some detective work. This chart depicts the previous bull run of 2014 and the bear market that lasted until nearly 2016.
The thing to pay attention to is the current phase we are in and what happened in the past.
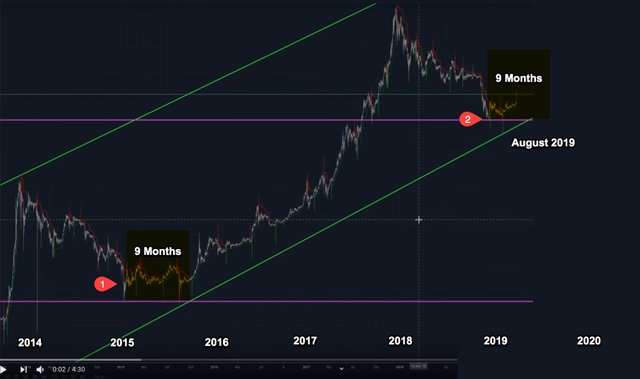
The last time the market bottomed, it took approx. 9 months to amble sideways before the market broke out into a proper bull run.
If you plot the same time scale, that would put a solid bull run somewhere around July-August, 2019.
Which is still several months away, despite the price spike yesterday and calls for a bull run by weary bear marketeers.
While everyone is high-fiving the giant green candle on the bitcoin chart ( and so they should ), that means no one is really looking out for risk at the moment ( which they are too drunk to do ).
Like anytime, there's plenty of risk to factor for. A giant green candle just changes the kinds of risk you have to be on the look out for. It doesn't eliminate danger.
- A giant green candle is the result of whale trading. Someone with a lot of capital that is an expert trader, has a strategy, which probably involves creating FOMO in the retail market.
- Ask yourself, why was this trade don't publicly and not over the counter in the private and stable-priced market? This person wanted their trade to stir retail / noobs in a 'candy from a baby' scenario.
- Recent reports suggest that up to 90% of trading volume is fake. Which, if true, makes the crypto market weaker than it actually is. And does not have the volume to support such a euphoric rise.
In my mind, sure, profits can be made but the risk profile is too high to enter the market unless you really know what you're doing and are 100% managing your trades.
In my mind, the risk of a price drop is high at the moment. And while I have a view to the upside, that view is weak by contrast against my view that we are going to see a slingshot to the downside.
A slingshot?
Yep.
What happens to retail sentiment if the price falls back to where it was? A massive deflation in sentiment. Any price reduction at this stage will trigger peoples anxieties about having to endure 'more bear market'. Technical chartists will see the current height as a resistance level to 'make or break' level. And so on.
In my mind, the sudden price spike is a catalyst for the downward move that has been on the cards. A 2-3 month downtrend. More sideways action to a firm bottom.
If I've learned anything from euphoric highs in the past, they don't last.
Thanks for watching,
Brendan Rohan - Indie developer of 'next gen' natural medicine from Melbourne, Australia
Www.Skyflowers.co ( see "botany" tab for the plant research )
Www.ClinicalFlowerTherapy.com
Social @iSkyflowers
YouTube Skyflowers.Tv
If you support natural medicine and an independent research project that began in 1997, then steem me. The creds I get will help me provide a solid body of information that future generations can build upon.
DISCLAIMER: This article and all information on this channel & all content is offered purely for educational & entertainment purposes. Always do your own research when investing money and seek the help of a registered financial advisor.