Horrible technical signals for both Bitcoin and Ethereum
(This is the three-year chart from www.cryptocompare.com)
Ethereum looks the worst as we have a clear long-term bearish triangle that just broke low, right after a confirmed mother-candle, inside bar, close-low signal:
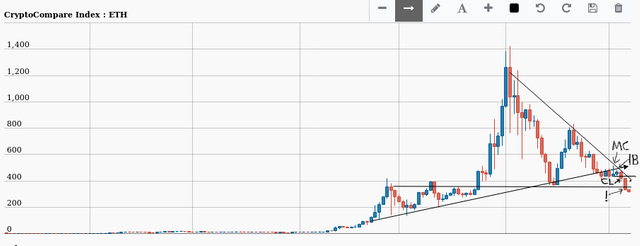
We also just broke-low on the bearish triangle. Very bad!
On BTC-USD, we still have the break below the bottom of the bearish triangle to come, but that's the only difference between the two. The charts are near 100% identical:
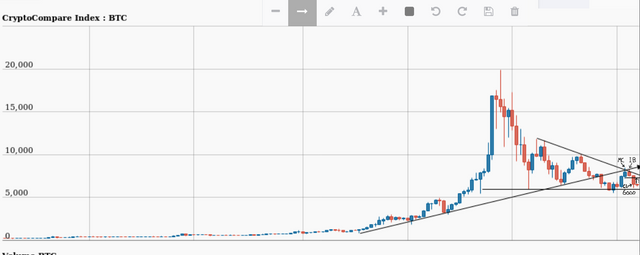
As you can see, BTC also refused to go back up and continue the longer term trend above the trend line, there's just no bullish power to drive it and if BTC moves back up, to then bounce off of the underside of the MC's bottom price extreme (the price extremes of MC's work like support-resistance) to then go back bearish, BTC will likely do what Ethereum just did, break the bottom side of the bearish triangle, and that's really bad.
This looks very bleak for those that got in much higher up. For those with money to spare, I see super great buying opportunities ahead. I'll personally be looking out for an equally strong bullish signal further down on the same chart and then, I'll be buying the cheapest of the state-supported Alts with the best use cases under them. That's the only positive thing, I see in the months ahead. We're also well into august now and aug-sept are historically known for big crashes in the markets.