Until we hurdle 11.8k I'm still bearish. Here's why...
Ooooh, everyone loves to be the first to spot and call a bullish pattern and/or run, don't they? And when everyone spots the same pattern, that is exactly the moment you should become skeptical. Especially, when whales are in the game attempting to manipulate outcome to their benefit.
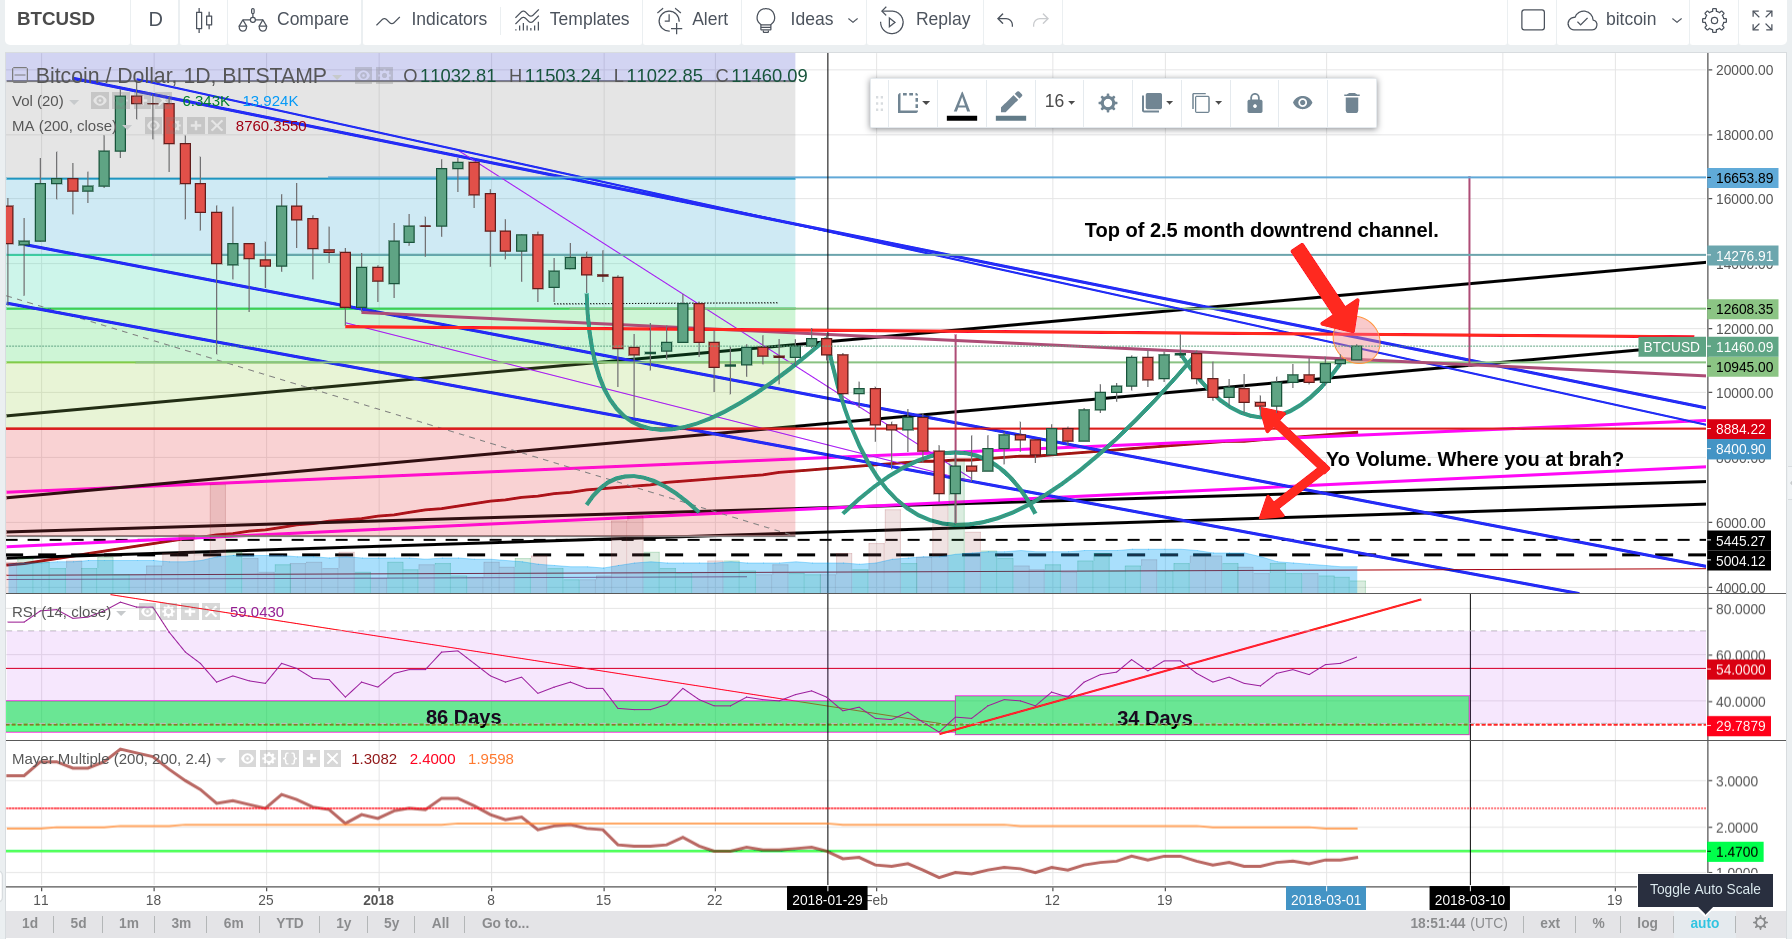
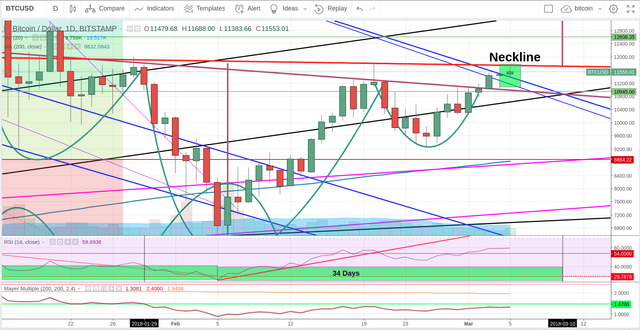
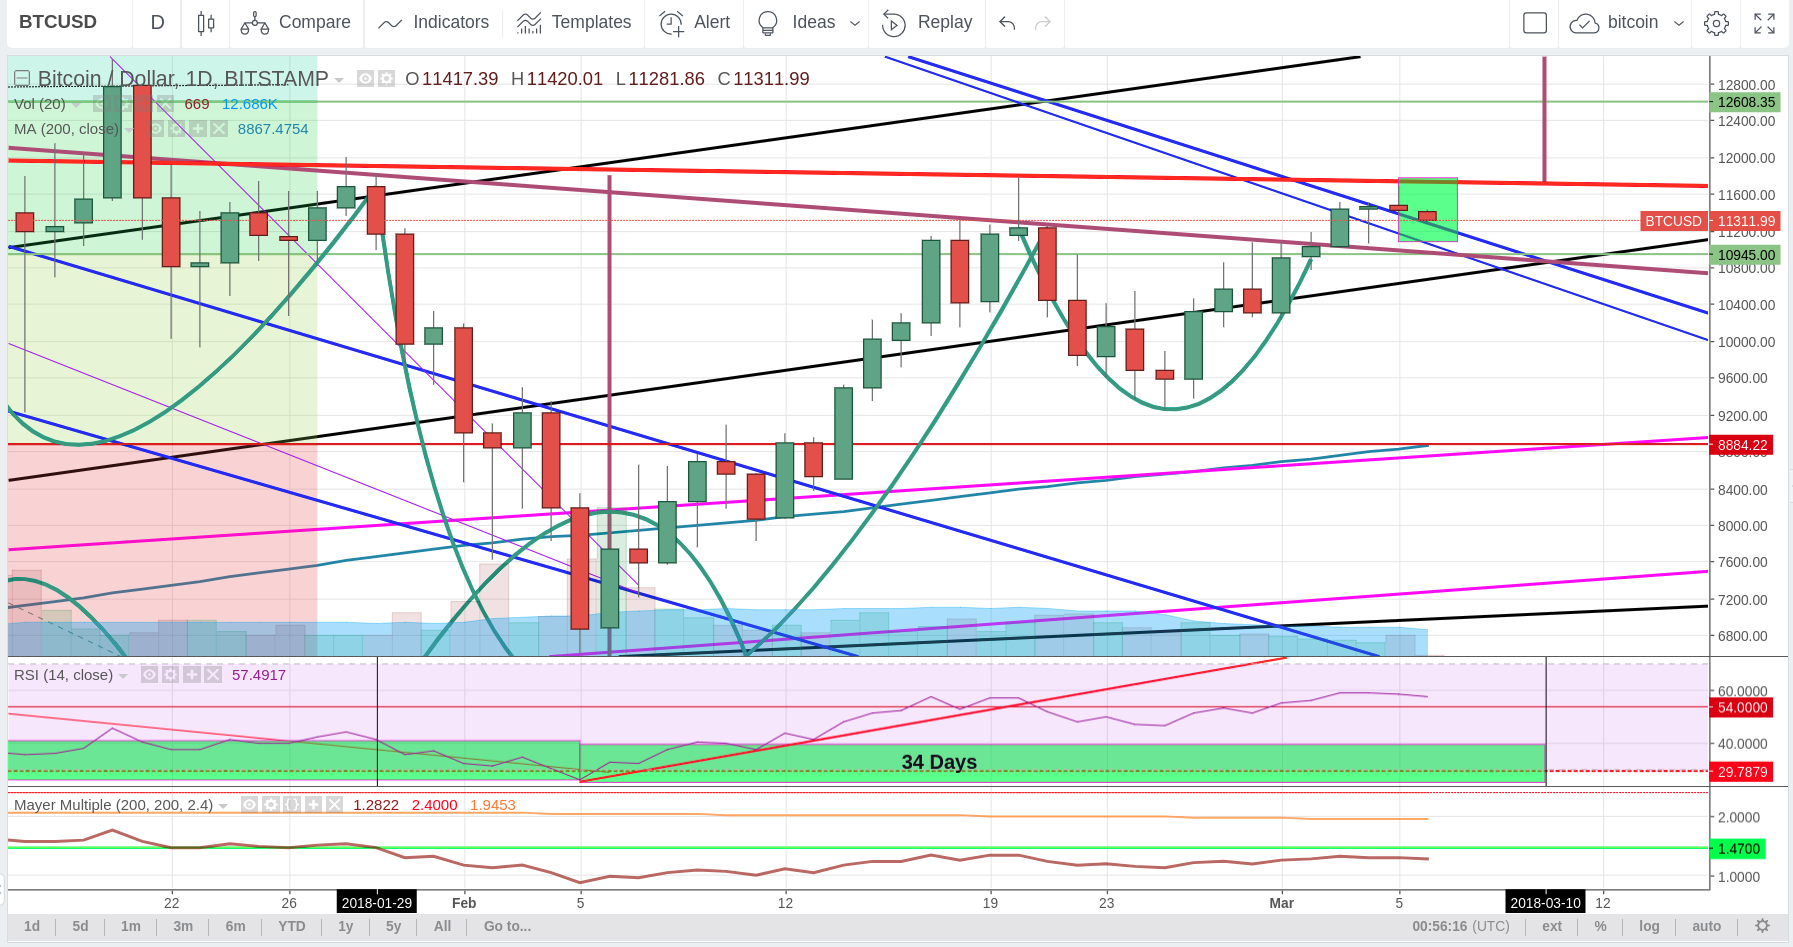
So, what I see here, and keep in mind this is according to the Bitstamp chart (which will look a bit different in price than other charts you'll see, mainly those calling for a bull run), I see two necklines that have been drawn for this inverse H&S that everybody has been pointing out. Three big problems with calling a bull run this early though:
The first - we've only just skirted the first neckline. Confirmation is a second candle on the daily opening and then also closing above that neckline. Additionally, you still have that second neckline in RED, which may actually be the true neckline. And NOTICE HOW IT INTERSECTS WITH THE TOP OF THE BLUE CHANNEL. This has been a longtime downtrend channel in place since the 18th of December. It is HIGHLY SIGNIFICANT and WILL provide significant resistance. I will NOT become bullish until we surpass this 11.8k level and confirm.
The second - as I have already alluded to, is that we still remain withing this bearish BLUE channel. We have touched the top twice already. This will be the third time. If we can't push through, big trouble.
The third - I fail to see volume on the right shoulder of this inverse H&S pattern. You can see that I have outlined the volume pops on the left shoulder and head, but where is the volume on the right shoulder. I haven't seen significant volume yet and this could indicate a problem.
BOTTOM LINE: I think a little skepticism here is healthy. A fair amount of buying restraint should be exercised UNTIL we have clearly crossed the 11.8k marker and confirmed it on the daily. Confirmation requires a second candle to be opened ABOVE 11.8k and then it must stay above that price point and close higher. Until then, I am happy to sit on the sidelines and observe.
Let me know what you think readers. Am I missing something?
UPDATE (SUNDAY MORNING):
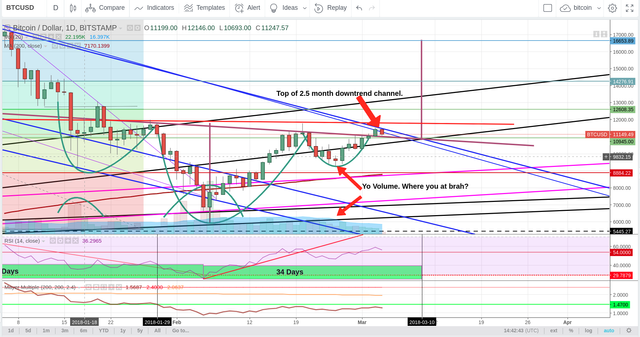
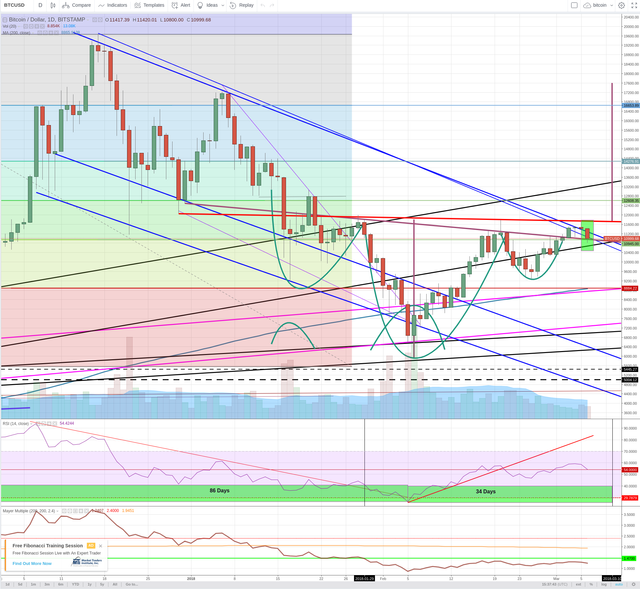
Last night confirmed strength of our 2.5 month downtrend channel. You can see that we hit our heads on the top of the channel and dropped down. Today or tomorrow should show us how much strength these bulls actually have. Watch closely!
UPDATE (SUNDAY NIGHT):
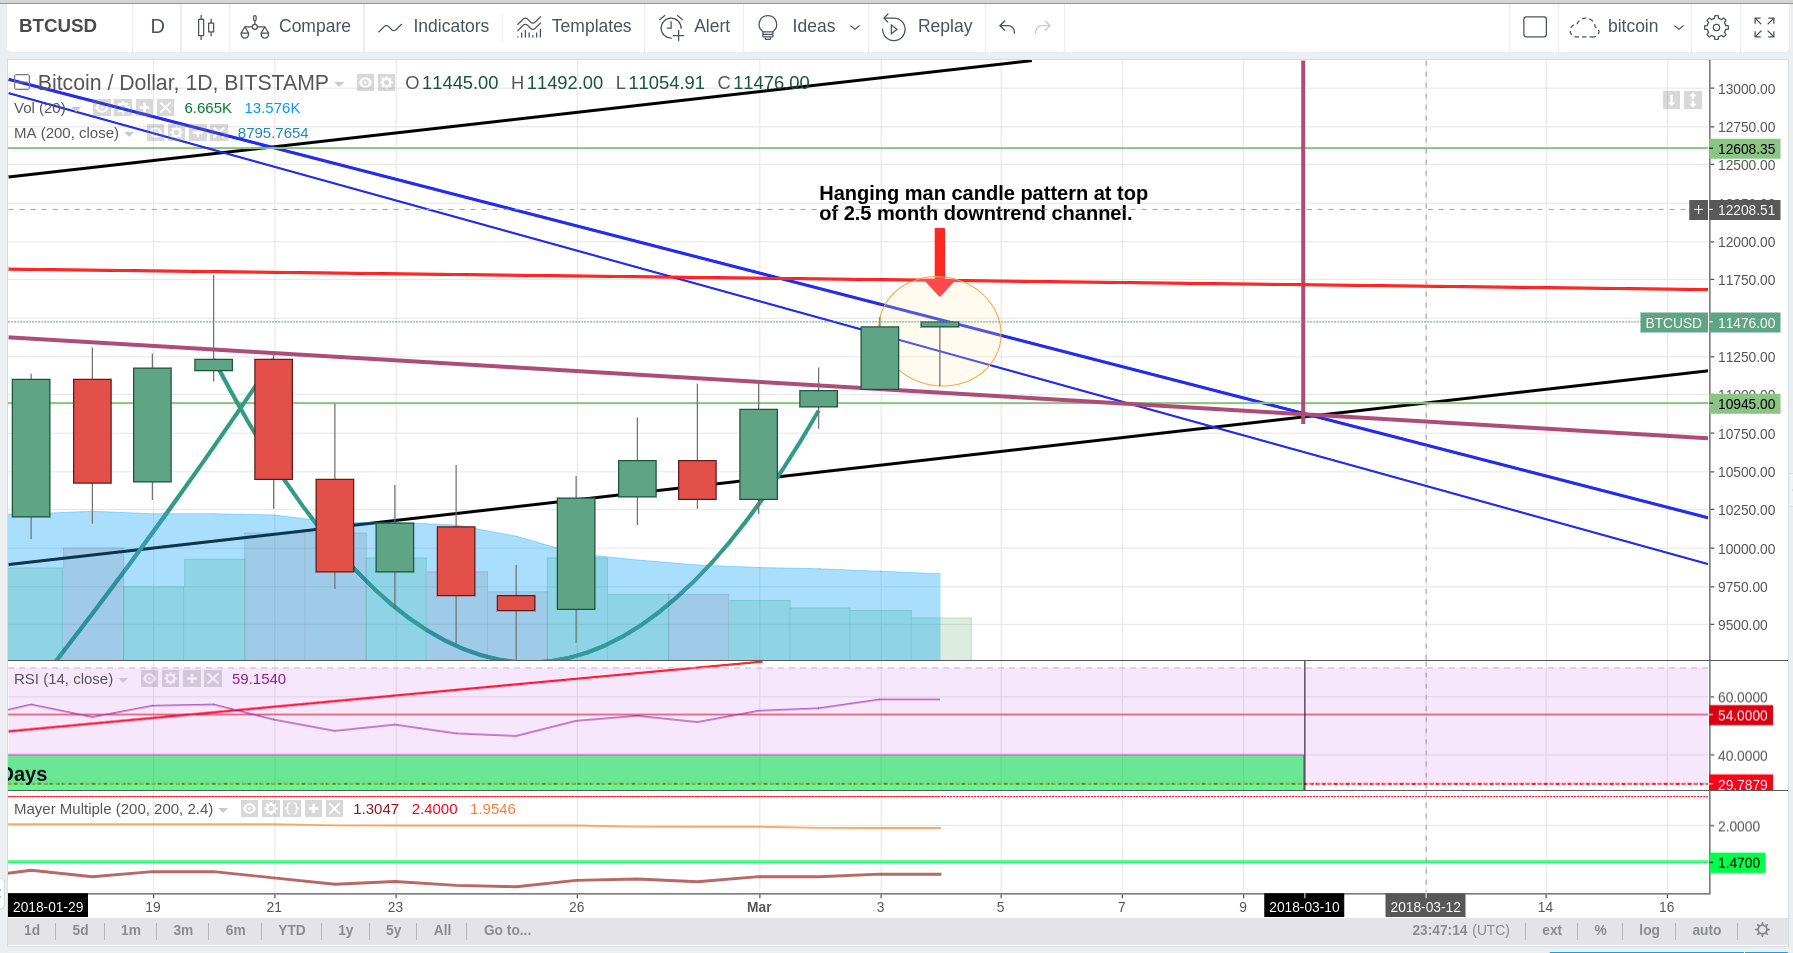
Hanging man candle pattern at the top of our long standing 2.5 month downtrend channel. Not a positive sign.
UPDATE (MONDAY NIGHT):
Today we tested the upper neckline. A little more volume. But we still couldn't push through and break that neckline. Baby steps? Or is this simply all the bulls can give us? Volume overall is still light. Weekly RSI still hovers at around 54. Although we've barely broken above our longstanding, 2.5 month downtrend channel, I am underwhelmed by these bulls thus far. Original statement still stands, I will not become a bullish unless I see a significant push above 11.8k (with volume) and followed by confirmation on the daily.
Peace.
UPDATE (MONDAY NIGHT #2):
We are now sitting on top of our channel. But will this hold us up? We should find out soon. More to come...
UPDATE (Tues. Mar. 6th):
This morning we broke back down into our 2.5 month descending blue channel. We sat on the 10.9k price point for 4-5 hours where our .382 fib retrace level intersected with the first drawn neckline that, unfortunately, many believed to be the breakout line.
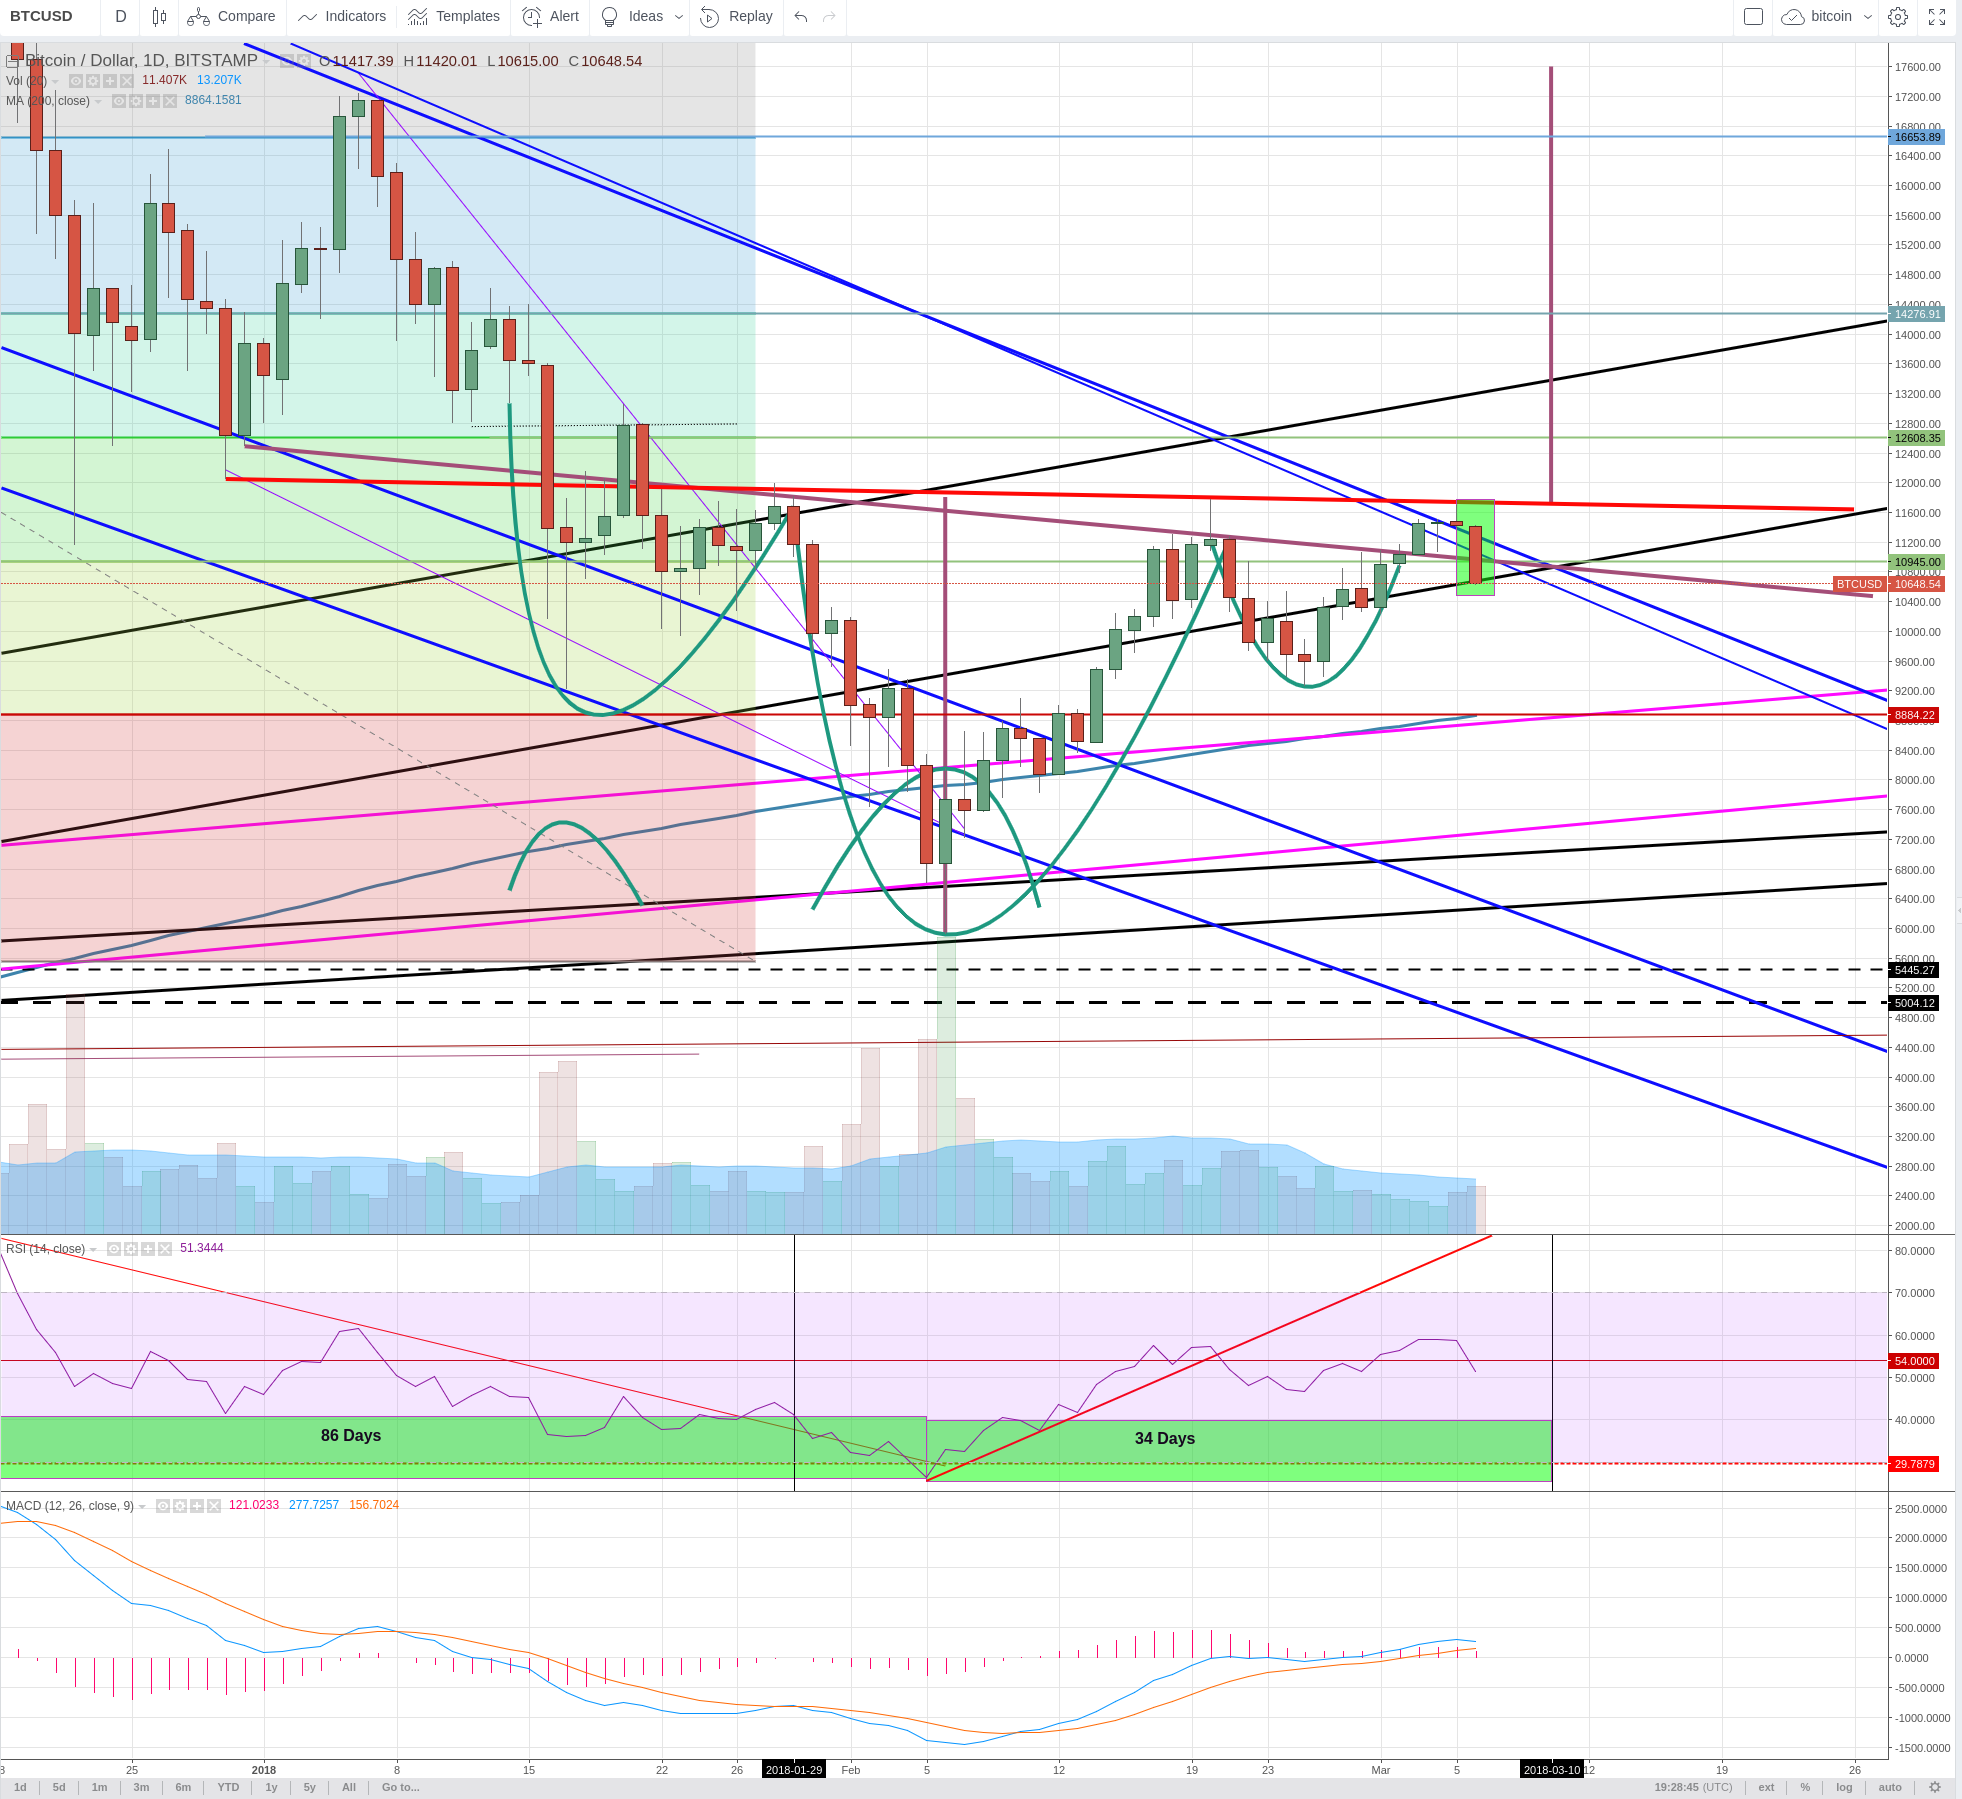
The bears then, proving they still had more in them, took us even further down to the bottom of our black ascending channel at 10.6k. If we break below this again, we will head back down to kiss our 200 day moving average one more time (currently at around $8865).
Keep in mind, there is a possibility that we could even retest our recent lows at around 6k and form a double bottom. Although, the probability of this occurring remains relatively slim at this point, given the strength that these bears are still showing, those odds are increasing daily.
Finally, I would be remiss if I didn't also mention a final scenario that the charts are still giving to me. This would be a final drop and touch of one of the support lines in our descending BLUE CHANNEL. Given time the price down there could be as low as 2-4k. Again, this is the least likely scenario. Nevertheless, it is still something I must mention as the charts are showing it as a possibility.
agreed, $11,800 will be the real test, we're not out of the wood yet. And that leading diagonal triangle is bearish as f*** for the short term. However, volume can come anytime, don't get confused with that. Look what happened on February 26th for example. News or events shall come to justify the forecast.
Agreed. And then sometimes they don't. There are enough negative indicators to justify equally that perspective. Either way, bulls and bears both know that something exciting is about to occur.
People are wierd, unless you give them good news they don't like you. It's good to be aware of all the options out there (alternative TA is allways useful, opens you up to posibilities you might not have seen). I had the same questions, some things don't add up (elliot waves look strange, volume confirmation isn't there , and most of all no semnificative channel breach so far ) https://steemit.com/btc/@tristiancnc/btc-price-for-the-next-weeks-15000-or-retesting-6000
Yes, it should be interesting either way here in the next few days.