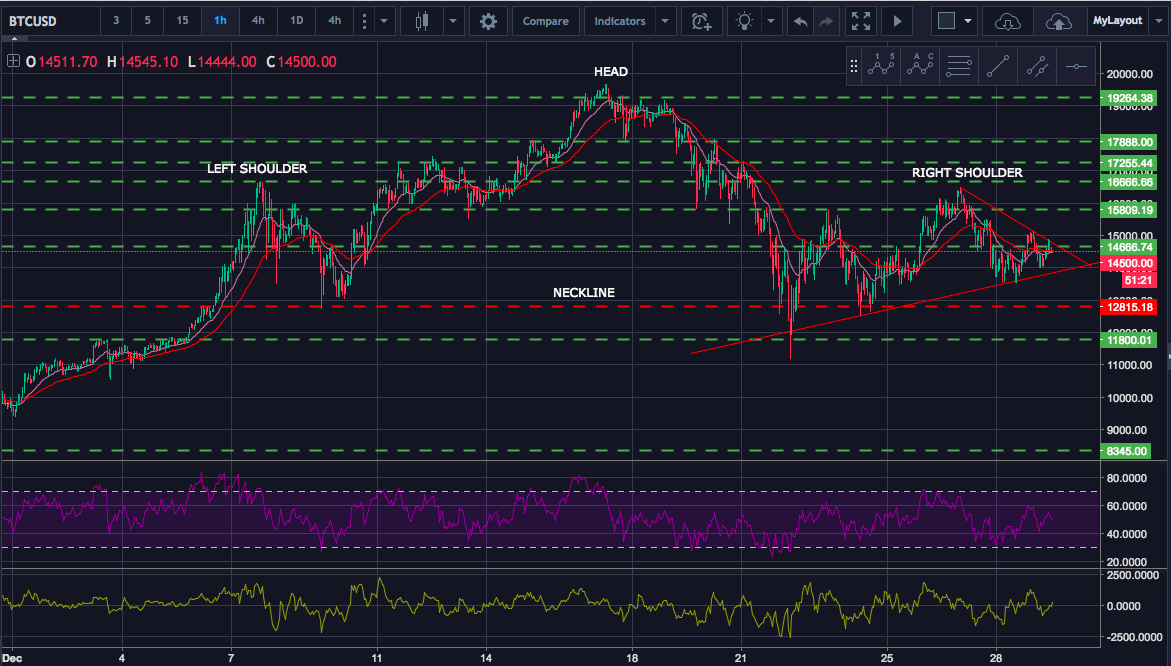
Ominous price pattern for Bitcoin

It looks as though bitcoin is forming a head and shoulders pattern. The pattern will be confirmed if price breaks decisively below the neckline, perhaps somewhere in the $12,500 level. If this does indeed play out, a potential target would be the $6000 level.
If you have any thoughts or questions about this wave count or elliott wave in general, please post them in the comments.
If you find this information insightful, please UPVOTE, RESTEEM, FOLLOW and consider a donation:
Donate ETH: 0x4f007Ca89120bFae6413987DF59b18403f181e9E
I am not a financial advisor. Be sure to do your own research.
Hello colleague @stocks29, I hope you feel very well :D. Very good post, I voted for it. I would like to invite you to follow me on my page @emmanuel250998 where I will be uploading every day the latest news about the world of cryptocurrencies. I also invite you to vote for my last post:
https://steemit.com/bitcoin/@emmanuel250998/bitcoin-price-will-range-from-usd6-500-to-usd22-000-in-2018-according-to-wall-street-analyst
I would very much appreciate your support. A big hug and greetings from Venezuela ;)
The volume does not confirm this pattern.
Only price pays. Volume is of secondary importance ;-)