BTC market interpretation:
market analysis review:
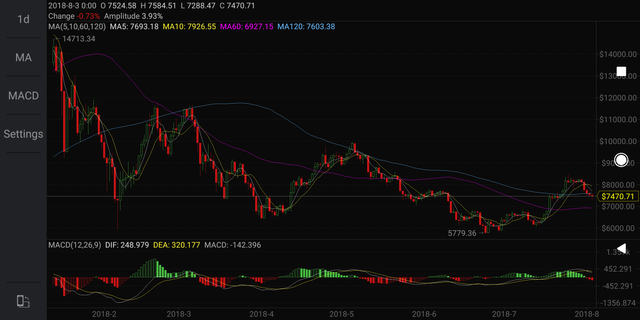
From the daily line, the MACD is still above the zero-axis, but the top line is top-of-the-line.
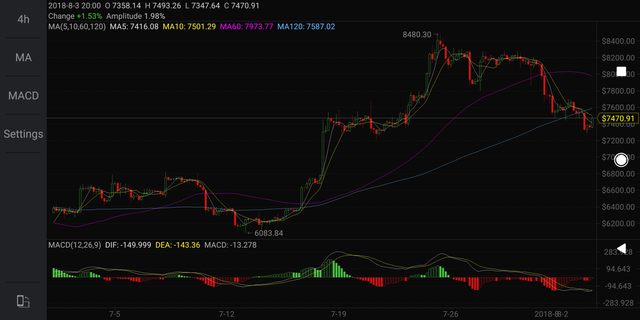
From the 4-hour chart, the 4 hours 60-day line and the 120-day line failed to form a good support.
Although there was some expectation for the rise in this analysis, it was still down after the consolidation. In fact, on the daily line, this time is a step back on the 120-day line. However, since the depth of the 120-day line is deeper and the top line of the daily line is formed, a certain position control is still required.
For the $6,900 buy-in, because the take profit is set at $7,300, today's decline has reached a minimum of $7,280, so the single is profitable and earns $400. Now wait for the short position.

 Let's take a look at today's graphics:
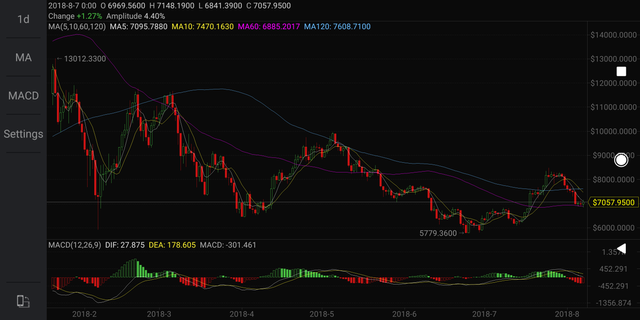
On the daily line, BTC fell below the 120-day line and gained some support on the 60-day line. The MACD basically completed the pull-back of the zero-axis.
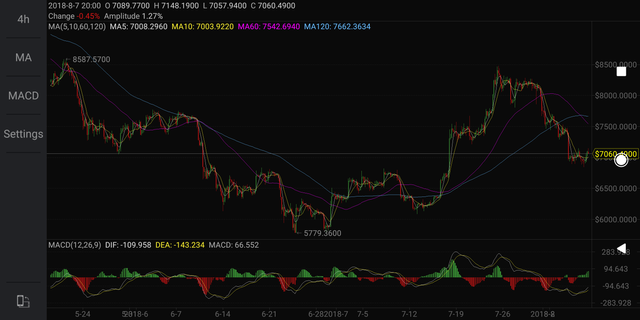
From the 4-hour K-line pattern, this pull back to the last 4 hours of the central top of the $ 6830 to get support to stop falling, basically in line with a three-buy form, we can find a suitable opportunity to participate in the sub-level. Of course, it is difficult to find a buying opportunity at the secondary level. If you can't capture the current trading opportunity, you can also buy through the breakout order of the secondary level.
And three buys don't mean you can definitely go up, so we have to set a stop loss when making a buy decision. We will break through the single-row at $7,200 and set the stop loss at $6,500.