Bitcoin (BTC) Daily Price Update- Bulls breakout or Bears Trap? (Charts)
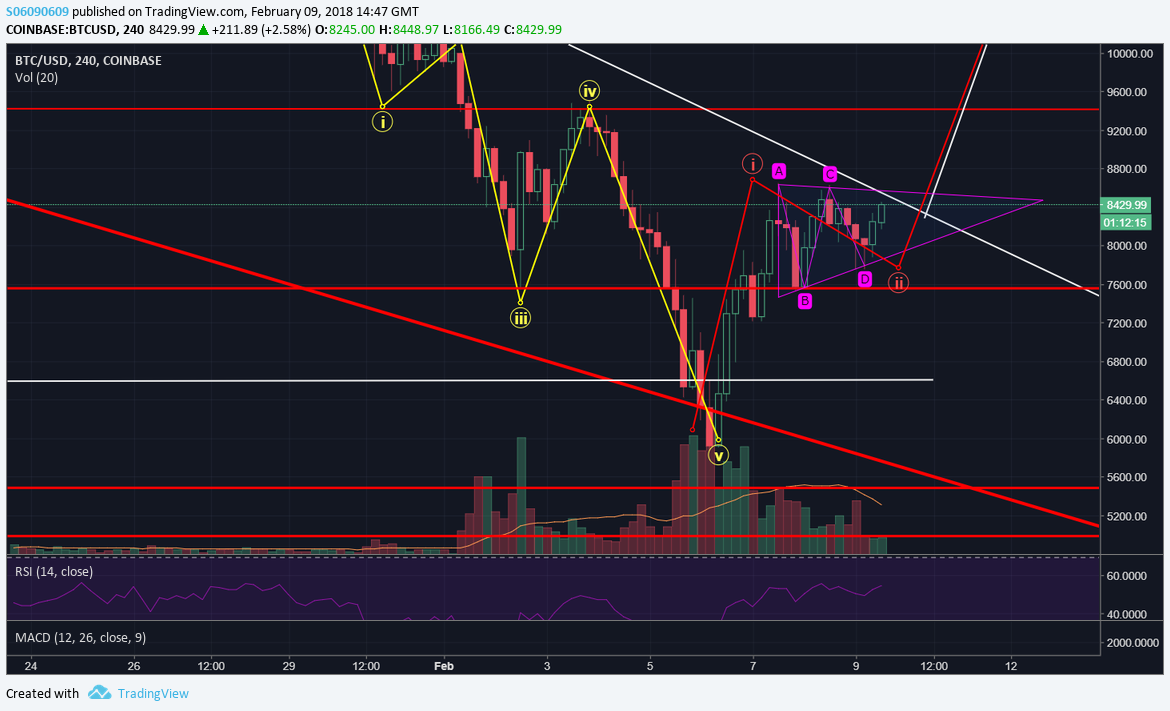
As was mentioned in last BTC update, a bullish bounce was very likely to occur from 5500-6000 price range. This is exactly what happened and now BTC is gathering strength just under top of the falling wedge. Right now, the price is forming bullish pennant and ascending triangle, which in itself is a bullish signal, what is more positive, is that it is so close to the top of falling wedge that breakout from ascending triangle is likely to cause breakout from the falling wedge as well.
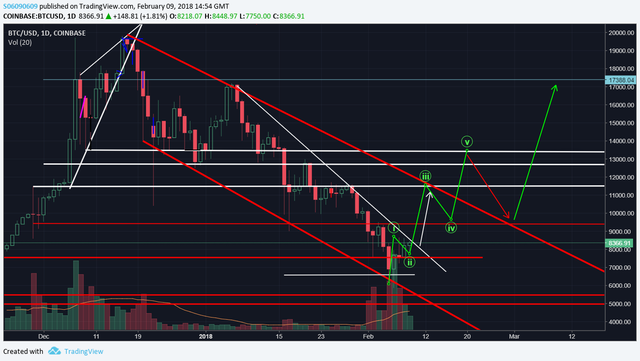
Falling wedge is extremely bullish pattern and breakout from it will be the FIRST OF TWO confirmations that will indicate an uptrend. Breakout from falling wedge will indicate start of a 3rd Elliott wave, likely to reach top of the falling channel at around 11500-12000 range, at which point wave 4 will commence. Wave 4 is probably going to be another consolidation and formation of some sort of smaller scale falling wedge before another breakout which will break falling trend line. This would be SECOND CONFIRMATION of a new uptrend.
Counterargument
We need to see an upward breakout from the ascending triangle as a further confirmation that falling wedge may be broken, otherwise, the price may bounce back to the lower region of falling wedge
ALWAYS USE STOP LOSSES
Twitter: https://twitter.com/DRyabich

Agree with the Elliot Wave Count presented here

We're headed to 13-14k, then retest to 10k before trying to retest higher highs.
I don't know. I don't see it yet. Not until we break 10k.