The volatility rate of bitcoins is down 98% year on year
The rate of btc fluctuation has declined over the past 12 months as the falling market has killed the bullish wave.
Daily volatility, the difference between the high and low prices, was $ 61 yesterday - a 98% down from the $ 3,468 recorded on 16 January 2018 - according to CoinMarketCap data. At the same time, the price of btc also decreased by 74% year-on-year. In general, with a sharp drop in price, volatility in the value of the dollar tends to decline at the same time.
It is worth noting that volatility was very high in terms of percentage 12 months ago. The trading range was 26% on 16 January 2018, indicating that the bustle of the digital currency market was at its peak at the time.
However, volatility fell as the year progressed, falling from $ 973 in the first quarter to $ 345, $ 245 and $ 195 in the following quarters, respectively. Meanwhile, in terms of percentage, the average daily volatility decreased from 9.14% to 3.6% during 2018.
This year has begun with more calm. Daily fluctuations remained well below $ 200. The lowest level in 2.5 months was at $ 45.17 on January 12. Many see price fluctuations as a sign of weak speculation, leaving the market and currency close to the bottom.
It should be noted that a long period of low volatility usually paves the way for a large upward movement. Consequently, the BTC may soon breach the six-day trading range of $ 3,500- $ 3700.
Furthermore, there appears to be a break in the range where long term technical charts are biased towards the bearish market.
Weekly Price Plan
As seen above, the BTC fell 13% last week, reinforcing the bearish 10-week moving average of $ 3,919.
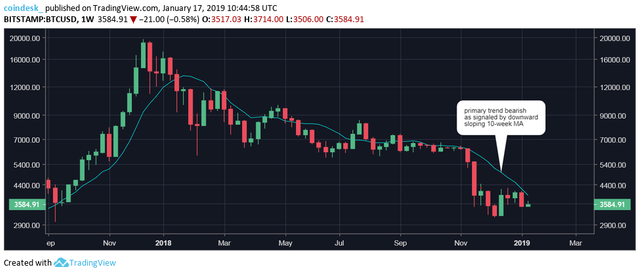
The outlook remains bearish as long as the BTC remains below the 10-week moving average.
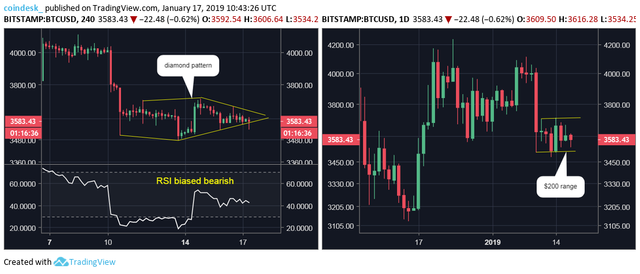
Price chart for four hours and daily chart
BTC showed the 4 hour chart's diamond pattern. The Bettokine currency broke the $ 3,700- $ 3,500 level. Going further down to the downside will rise significantly if the diamond pattern is breached on the downside.
( )
)
The Relative Strength Index (RSI) is heading towards a 14-day downtrend. Therefore, there is ample scope for post-crash selling. Simply put, the probability of a BTC break of the range between $ 3,700 and $ 3,500 in a downward trend will increase significantly if the crash of the diamond model is confirmed.
Point of view
BTC is likely to see a negative break in the range between $ 3,700 and $ 3,500. The $ 4,000 price tag will be back on the table if the developer can challenge the bearish models on long term charts with a move above $ 3,700.
Do you think we might see BTC flipped in mcap by another project in the next bull run?
Posted using Partiko Android
Thank you so much for sharing this amazing post with us!
Have you heard about Partiko? It’s a really convenient mobile app for Steem! With Partiko, you can easily see what’s going on in the Steem community, make posts and comments (no beneficiary cut forever!), and always stayed connected with your followers via push notification!
Partiko also rewards you with Partiko Points (3000 Partiko Point bonus when you first use it!), and Partiko Points can be converted into Steem tokens. You can earn Partiko Points easily by making posts and comments using Partiko.
We also noticed that your Steem Power is low. We will be very happy to delegate 15 Steem Power to you once you have made a post using Partiko! With more Steem Power, you can make more posts and comments, and earn more rewards!
If that all sounds interesting, you can:
Thank you so much for reading this message!