Bitcoin Battling of Long-term Trendlines
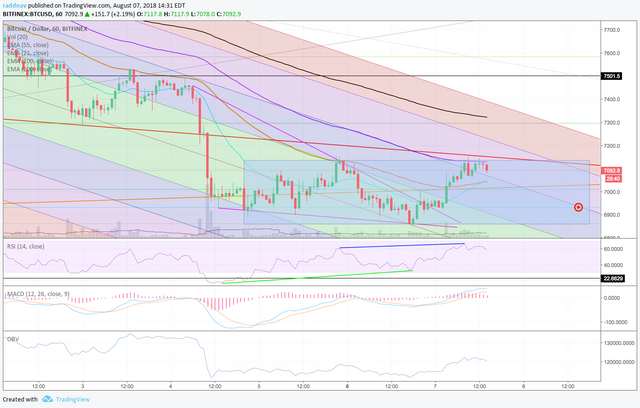
On the hourly analog Bitcoin Bitfinex chart we have had a good bear trend the past 10 days which taken price from around the $8,200 level down to about $6,900. That’s a $1,300 haircut or about a 16% drop from the highs a few weeks ago.
Right now price appears to be consolidating in a range from $6,860 to $7,135 where price has been halted on an advance earlier today. I have drawn a blue rectangle on the chart below that could represent a bearish flag from price dropping from up by $7,500 on Saturday August 4th.
Price has not been able to break above the orange 55 EMA on this period bear trend since July 31, until it popped through that level around $7,025 at 3:00am EST this morning. That is an encouraging sign that the ship may be turning into the bulls direction, but the halt at $7,135 in conjunction with the purple 100 EMA line and the long-term red down trending line at about $7,150 will be the important resistance to break. I would anticipate at retest of the orange 55 EMA line around $7,050 before deciding whether to enter any position.
I have also drawn a down-trending pitchfork from the pivot high on July 24th to the swing low on July 27th and back to the swing high on July 28th to get an idea of some critical levels on this down-trend. Price has mainly been contained within the purple 1.5 standard deviation range and is currently residing just on the outside of the upper blue channel. A retest of this channel level in convergence with the other indicators at $7,050 over the next few hours appears likely.
The RSI level is fairly neutral at 56.88 and is showing some signs of a moderate hidden continued bearish divergence marked with the blue line. Additionally there is some older strong bullish reversal divergence as well. marked with the green line. Perhaps price heads down to test that red target around $6929 sometime tomorrow.
The MACD is in decent shape on the positive side of that zero bound line indicating bullish momentum, but the trigger line EMA is curling down bearishly as well as the histogram down ticking. The OBV is also showing a higher balance so which could be a bullish indicator, however I would like to see how much the balance declines over the next few hours here to see if the money sticks around.
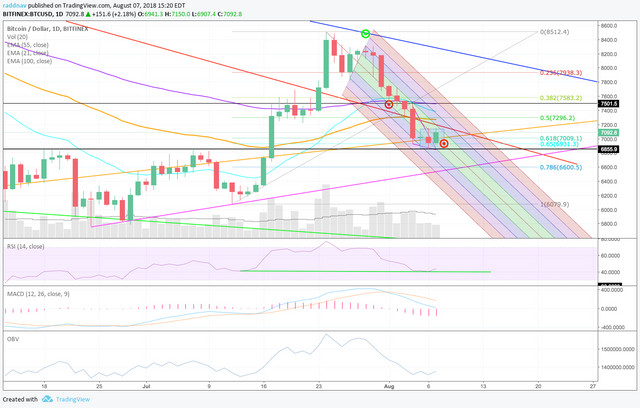
On the daily analog Bitcoin Bitfinex chart, you can see a Fibonacci retracement from the low on July 12th around $6,079 which could be the end of Wave 2 and it stretches all the way up to $8,514, which appears to be Wave 3.
There has been a retracement all the way back to the green .618 level at $7,009 and a little beyond it to the .65 level $6,931. Wave 4, which price appears to be on right now, typically will retrace back to wave 1 before beginning a next leg higher.
I have drawn a black horizontal line at $6,855 which does not touch it exactly, but could be the end of Wave 4. There is a $8 difference between the Wave 1 high at $6,839 and yesterday’s potential Wave 4 low at $6,847. This is a good sign for the bulls if the Elliot Wave counts hold up.
Price is currently running through a very long term orange up-trend line sitting at $7,100 and is just below a long term red down-trending line at $7,191. To say this is a critical level is an understatement and will be very important for what happens next. The orange line dates back to March 25th of 2017 and the red line to December 9th of 2017. Typically the longer duration trend will win out.
Price has even broken out of both of these trend lines previously and have come back to revisit these levels. Now price is sitting right in between them with only about 5 days left for this to be resolved. Chances are we see some big volume sometime before this in the next few days to confirm.
If price does continue to fall the blue .786 Fib retracement at $6,600 should provide a strong support and would also be in conjunction with the pink support line from the lows on June 24th.
The RSI indicator is at 44.41 and is relatively neutral showing some hidden strong continued bullish divergence as marked with the green line. The MACD also has a high probability to turning bullish with a large separation of the down-trending EMAs, and if today’s price holds an uptick on the histogram as well.
-More on Vanddar.com