Where are we at in the BTC market cycle?
Happy Monday everyone!
If you're in Texas, you might be growing agitated with the heat and it might be affecting your trades. You might be on tilt because it hasn't been under 100 degrees in a metric decade. I wouldn't know of course, but you might.
Let's re-visit an earlier theme of market cycle comparisons as it seems like we're still on track per my post from two weeks ago. I'll incorporate a little recap so you don't need to go read it. :)
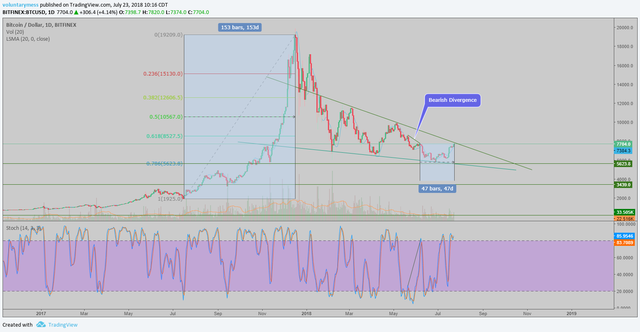
Price action confirmed bearish divergence last month on the daily chart, sending price plummeting downward and into an inverse head & shoulders pattern. This all occurred in the 2013 cycle as well. Once price broke out of the iH&S pattern upward, bulls briefly took control and pushed price to the 618 fib retracement level in the final bull trap of the cycle.
.png)
If that same price action occurs with this cycle, we'll see a rush to a price level of around 8530 (618 fib), followed by the final plunge of the cycle down to ~3500. This will put in the bottom and start the new bull run. Of course, history doesn't repeat but it rhymes.
If you want to trade with leverage, check out Bitmex with this link - no KYC and no hassles!
https://www.bitmex.com/register/UhBYnD