AFTER THE BREAKOUT WHERE IS BITCOIN HEADED NEXT
Bitcoin saw a nice bump recently after the news that Black Rock, , a huge investment firm is looking closely at adding cryptos to one of their assets.
They manage over $6-trillion in funds. They could buy the whole crypto market themselves, not that it is all for sale, but you get the point. Even buying in 2% of their funds would be huge.
Things may have cooled off a bit, but that is normal. To help understand the price action and where Bitcoin may be headed,our Technical Analysis research team leader put together this report about where Bitcoin may be headed next.
After a significant downtrend, Bitcoin starts its correction after forming bottom around $5770 Area. This could be the final support area for Bitcoin.
I am sharing 2 different time frames of Bitcoin analysis to share my expected thoughts about BTC’s next move.
Daily Time Frame Technical Analysis (Long-term)
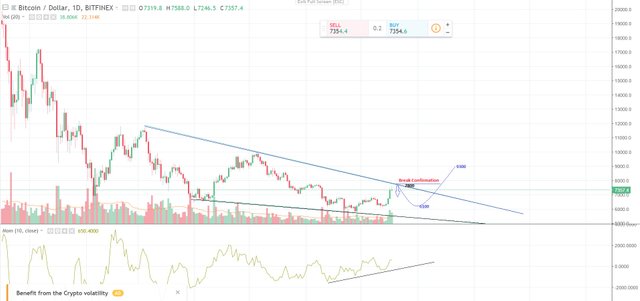
Bitcoin is moving in descending triangle formation in Daily time chart, the support was around $5770 and it bounces from the support towards its resistance level which is at the $7700-7800 area.
The price hit $7600 level recently and the current market price is $7422.
I am expecting a little bit more upwards movement towards $7800 and then it could reverse back. The minimum bearish target could be 6700, 6100 and 5300 in case of extension.
We are expecting a bounce from these retracement levels towards a new high.
Bitcoin may hit a $9300 high once the price breaks the resistance of descending channel shown in the chart below.
We will jump in the bullish rally after confirmation of break from what I have mentioned would be the breakout level in the chart below.
Bitcoin Daily Time Frame Technical Chart (Click to see bigger version)
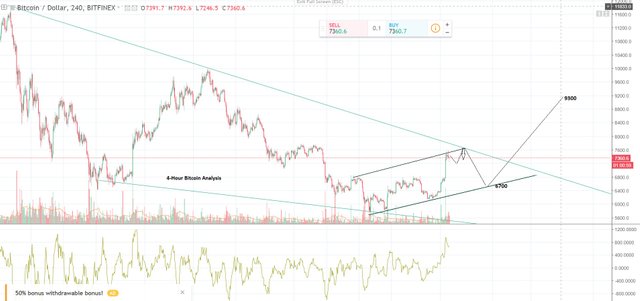
Bitcoin 4-Hour Time Frame Technical Analysis
The smaller time frame chart always helps us to spot the earliest trend. I love to share 4-Hour chart because we can a see a close picture of market overview.
The price is moving in rising channel in the 4-Hour Bitcoin chart and this rising channel is in favor of the bullish move in upcoming days. The current market price is $7422 level and a couple of reversal candles from the resistance area is indicating a bearish move may start soon.
We will have to look, what maybe the target of this bearish move. The minimum expected target is $6700 level which is also the first support level of Bitcoin. The movement below $6700 level could take Bitcoin towards new low around $5100.
We will look for bullish entry from $6700 if the price moves up. The break of resistance line shown in the green color in the chart below may help us to get the earliest breakout signal and breakout confirmation may take price towards $9300 level which is also a long-term bullish target for Bitcoin.
Please have a look at 4-Hour Bitcoin Technical chart below, I have drawn a possible next movement diagram with target levels.
Bitcoin 4-Hour Technical Chart (Click to see bigger version)
In Summary...
Bitcoin Support & Resistance Levels
Support 1 : $6700
Support 2 : $6100
Support 3 : $5300
Resistance 1 : $7700-800
Please keep in mind, the longer term bullish target will confirm once the break will clearly break its resistance level shown in 4-hour and daily chart above.
We'll be keeping an eye on the markets and continue helping understanding the changes in the marketplace.
Super resistance at 7800$ level if it breaks then we can welcome bitcoin above 8000$. Fingers crossed.
I agree sir