BITCORE (BTX): Is a Breakout Next?
SUMMARY
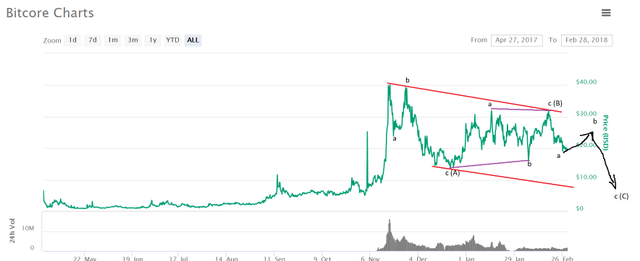
Bitcore (BTX) daily chart shows a clear markings of a lateral symmetrical triangle labeled with abcde. IF the e wave is complete and does NOT breach the lower bottom line decisively; then the likely next price move is expected to be upward. When drawing chart patterns, I do take liberty in cutting out or ignoring some price wicks as you can see, the tallest wick is not considered for the pattern or Elliott Wave counting.
The blue line outlines a projected pathway where an impulse set of five waves can be established. I've also added the time line projection as well. The condition is that the lower support line needs to hold and not be breached decisively. It could, however, be temporarily pierced and if so, it would be bullish since a bull wick would identifiable.
Legal Disclaimer: I am not a financial advisor nor is any content in this article presented as financial advice. The information provided in this blog post and any other posts that I make and any accompanying material is for informational purposes only. It should not be considered financial or investment advice of any kind. One should consult with a financial or investment professional to determine what may be best for your individual needs. Plain English: This is only my opinion, make of it what you wish. What does this mean? It means it's not advice nor recommendation to either buy or sell anything! It's only meant for use as informative or entertainment purposes.
Please consider reviewing these Tutorials on:
Elliott Wave Counting Tutorial #1
Elliott Wave Counting Tutorial #2
Elliott Wave Counting Tutorial #3
Laddering and Buy/Sell Setups.
Laddering Example with EOS
Tutorial on the use of Fibonacci & Elliott Waves
@haejin's Trading Nuggets
Essay: Is Technical Analysis a Quantum Event?
Follow me on Twitter for Real Time Alerts!!
Follow me on StockTwits for UpDates!!
--
--

Wow this a great analysis, above all it is offering hope to the discouraged cryto investors
You did an analysis of TRON, could you do Odyssey (OCN)? It looks like there will be a HUGE outbreak, similar to TRON.
He is an adventurous world that can win and lose
Your charts and analysis doesn't represent real situation at all!
The correction still not over, here is real view of this cryptocurrency:
How with small peace of structure can you make forecast?
Thanks :) I am always looking for feedback regarding the data I should show.
Both counts are good. Anyway it's a correction of a first impulse wave. If the triangle is breached down then another down is likely, if the triangle is breached up it could be the beginning of an impulse up.
Good luck with a triangle pattern that don't exist on real chart. On the other hand, it's not about the counting, he is providing price forecast on which people are doing investment decisions!
Coins mentioned in post:
Amazing information. @haejin
Now a days bitcoin is the king of world
Muy informativo, gracias por compartir.
Thanks for sharing @haejin. I always follows your analysis. I hope you'll post some analysis about EOS. Thanks!
nice
I will tomorrow. Thx
There are also some important announcements happened today. You may follow here.