Understanding the SmartCash Emission Curve and Distribution Rates


An important dynamic to understand of any cryptocurrency project is the monetary supply. Is it a fixed supply, is it unlimited? What's the emission rate? Then there are also details like what's the block reward, how often are blocks, was there a pre-mine? Then if you delve into ICO territory there are a whole range of questions about pre-sales which don't apply to SmartCash (it was not done through a pre-sale).
To summarize the SmartCash monetary characteristics here are some details of the blockchain algorithm:
Max Supply: 5 Billion
Total (Current) Supply: 1,611,721,491 (live stat on http://explorer3.smartcash.cc/)
Premine: None
Presale: None
Block Reward: 5000 * 143,500/BlockHeight (max of 5,000 block reward in any block).
Genesis Block: 11th Jul 2017 16:24:28, http://explorer3.smartcash.cc/block/00000009c4e61bee0e8d6236f847bb1dd23f4c61ca5240b74852184c9bf98c30
Block Timings: 55 second average.
This is the equation for coins generated each block: 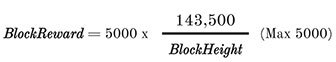
It's important to note that the maximum BlockReward of 5,000 means the first blocks were all generating 5,000 SMART each. After the important 143,500 block (about 91.34 days by number of blocks estimate, but it actually took 101.2 days or 145729 minutes) Block Rewards can begin to reduce. At block #143,514, the reward begins due reduce and the first block reward of a total of 4999.00000000 is found. At that point, the rewards will begin to decline.
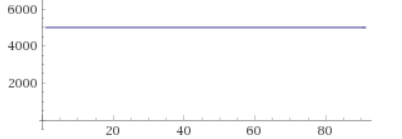
The first 143513 blocks just looked like a flat curve like so:
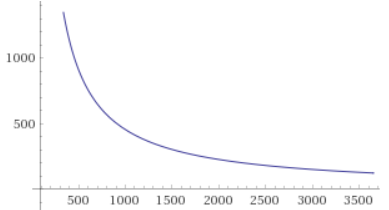
Here is a look at the amount of each Block Reward is from day that block onwards. It's interesting to note that while it was estimated to start at 91.
plot 5000 * 143500/(x*1572.72), x from 91.24 to 365
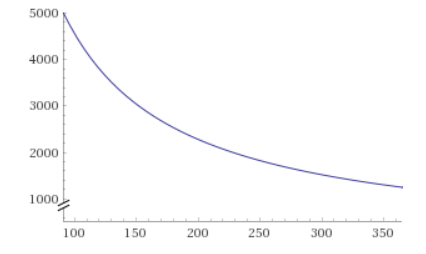
998,173,000 coins are generated in this interval, plus the original 143,513*5000 (717,565,000) from the original flat 5,000 SmartCash emission rate. First year is approximately then 717,565,000+998,173,000=1,715,738,000 or 34.31% of the maximum supply.
Year 2 generates an additional 500 Million SmartCash, bringing the total supply to about 2.2 Billion out of the total 5 Billion, or 44% (calculation here).
Year 3 generates even less about 291.7 Million more SmartCash (calculation here), for a total supply of about 50%, or 2.5Billion out of 5 Billion. The remainder is spread over the next 121 years.
We're at the blockheight equivalent of 315 presently near the end of that curve. You can see the rate of block rewards decreasing is slowing down.
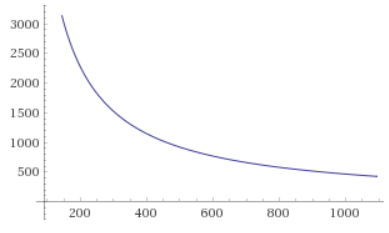
You can also look at a 3year plot of the emission curve using the following:
plot 5000 * 143500/(x*1572.72), x from 91.24 to 1095
Note that the Y-axis is scaled only to 3000.
Or a ten year plot with this.
Again, the y-axis shrinks to show more detail.
You may be noticing that the longer out these guy the steeper these curves look. That's because the coin generation is rapidly decreasing.
Take a look at 125 years, the total emission curve (at about 124.3 years the block rewards will stop due to rounding). We can do that with this equation that takes the average blocks per year:
plot 5000 * 143500/(x*573454.54), x from 1 to 125
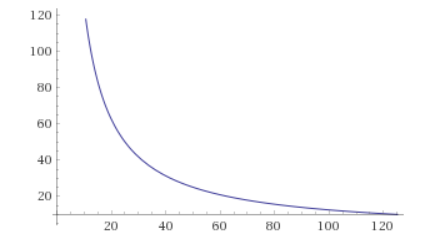
One interpretation to make is that there will be less new SmartCash created over time, and half of maximum supply will be created in the first 3 years. About 1/3rd of the total supply is created in the first year.
Another consideration is that the project / develop treasuries will be pretty well stocked so it may be possible in the future to allocate more of block rewards to supporting marginal cost infrastructure, such as different types of nodes (or mining) to continue to strength the core blockchain economics.
I'll also leave a note stating that this conversion of blocks into time intervals isn't perfect, as the blockchain time will undulate over time. Also, the first few months took a bit longer than expected to mine so there is a slight shift in that. Overall though, the trend is still accurate and it is easy to count up the actual emission from the blockheight or using the blockchain tx data directly.
So there you go, now you know a bit more about the supply side of SmartCash. It operates under an algorithmic schedule coded in the system itself.
It also looks very different than circulating supply of any major banknote.
Posted from my blog with SteemPress : https://smartcash.blockchainlibrary.org/2018/06/understanding-the-smartcash-emission-curve-and-distribution-rates/