Bitcoin Is Back Above $11,500, But Bulls Not Out of the Woods Yet
 Despite a sharp price recovery to over
$11,500 today, bitcoin's bulls are not out of
the woods yet, the price charts suggest.
Coindesk's Bitcoin Price Index (BPI) has
climbed 25.9 percent from the eight-week low
of $9,199.59 hit yesterday at 15:44 UTC. As of
writing, bitcoin (BTC) is trading at $11,590
levels.
The world's largest cryptocurrency by market
capitalization has appreciated by 8 percent in
the last 24 hours, according to data source
OnChainFX.
However, the investor community isn't
convinced by the move, and comments on
social media show that some believe the
overnight recovery is nothing more than a
"dead cat bounce ."
The price chart analysis indicates that only a
close (as per UTC) above $12,500 (prices as
per Coinbase) would add credence to rebound
from sub-100-day moving average (MA) levels
and confirm that a short-term bottom is in
place.
Bitcoin chart: Bottom in place?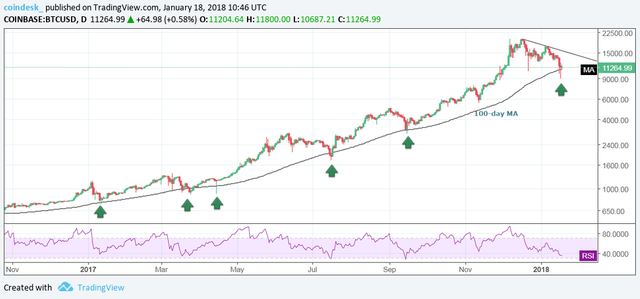 As seen on the chart above (prices as
per Coinbase), bitcoin has consistently
left higher lows at/below the 100-day
MA line.
On the previous two occasions, the
relative strength index (RSI) showed
oversold conditions.
As of today, the RSI is staying within
the oversold territory (above 30.00).
Bitcoin's drop below the 100-day MA
yesterday was short-lived.
The situation looks similar to that seen in mid/
late March 2017, when BTC prices flirted with
100-day MA for more than a week before
moving higher. Back then, the RSI was just
shy of oversold conditions
Still, it appears to be too early to call a
bottom.
Yesterday's long-tailed candle (big difference
between intraday low and UTC close) does
show strong dip demand. However, only a
positive close today would validate the sharp
recovery from $9,005 (previous day's low).
Bitcoin chart: Bulls need a close above
$12,500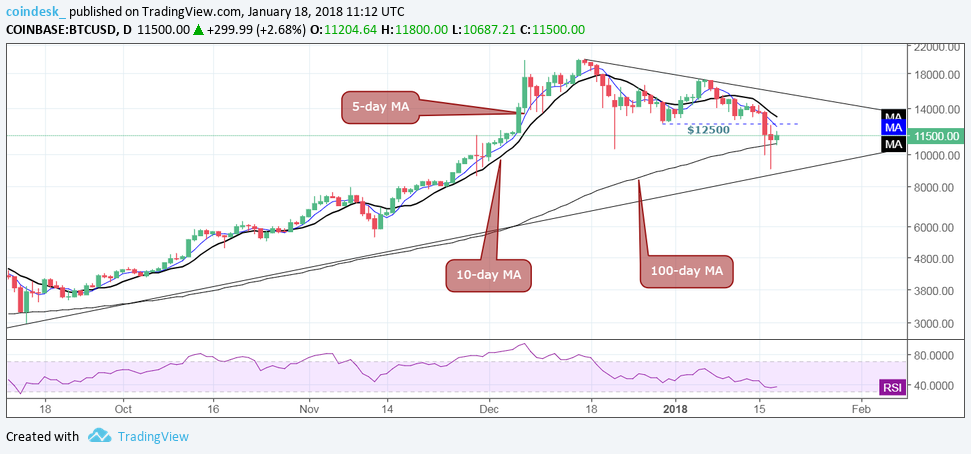 The above chart (prices as per Coinbase)
shows:
A long-tailed candle indicating dip
demand near the ascending trendline
(drawn from July low and September
low) support.
Lower highs and lower lows as
indicated by the descending trendline
and a drop below $12,500 on
Tuesday.
5-day and 10-day MAs carry a strong
bearish bias (sloping downwards).
The RSI remains below 50.00 (in the
bearish territory).
Except for the first point, all other factors
favor a drop to $8,690–$8,052 (61.8 percent
Fibonacci retracement of 2017 rally).
View
The recovery from $9,005 has
neutralized the immediate bearish
outlook.
The daily chart suggests that a
historical pattern (higher lows along
the 100-day MA) could be repeated.
However, only a close (as per UTC)
above $12,500 (Dec. 30 low) would
confirm a bottom is in place at $9,005
(previous day's low) and open the
doors for a rally to $15,800
(descending trendline hurdle) and
beyond.
The sell-off would resume if BTC fails
to hold above the 100-day MA over
the next 48 hours. In such a scenario,
prices could test $8,690–$8,052 (61.8
percent Fibonacci retracement of 2017
rally).
I think we are going to see this bouncing around $11k-12.5 going on for awhile, at least until the end of January. It's always a rough month for crypto, investors will break out of the winter blues in the next couple of months though hopefully.