Could Bitcoin Possibly be Proceeding Quickly Back to the 6,000 Level
Anyone who's been following this blog probably knows that trading analysis is seriously frowned upon here, in favor of fundamental value analysis of the asset. However, as has been mentioned before in one of the earlier blogs, some of the lines drawn in TA and the basis behind them are sometimes reflection of the fundamental value behind the asset. Take the formation of ascending and descending triangles as an example, and the supports that cause them to form.
A descending triangle usually points to an asset whose fundamental value is at the time significantly lower than its price, but for which many of its holders refuse to accept that lower value and continue to buy the asset at some sentimental value (termed support) thus delaying its fall to its true lower value. The asset may then bounce of this buying point a few times but will keep returning to it. And each time it bounces off it keeps falling back from a lower level than the former high point. This continues until reality prevails or the finite resources of the holders is exhausted and the asset falls through that support.
We see that happen with Bitcoin twice over the past 12 months. First, when it plummeted through the 6100 point off a height of about 8300.
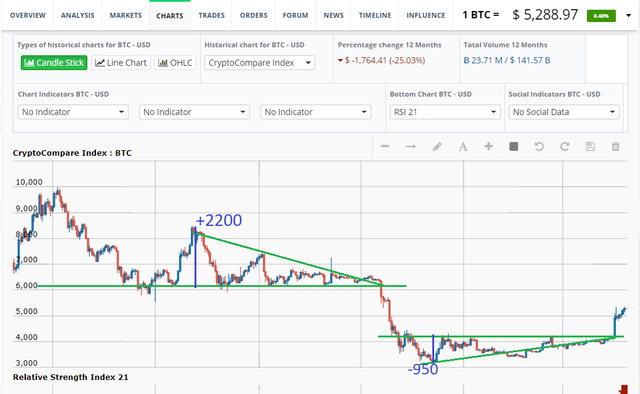
(Source: https://www.cryptocompare.com/coins/btc/charts/USD?p=12M at at 04-08-2019)
The resulting fall then undershoots and formed its own ascending triangle with similar dynamics. In this case, many were seriously jaded by the huge fall, and the analysts were all posting gloom and predictions of 1,000 bitcoin sufficient to cause a lot of holders to cash out at about the 4,160 price. And every time the value approached that point, sellers were available to cash out and repel its value lower, but each time not as low as the prior low point. The eventual breakout occurred as several fundamentals was already pointing to a higher value, and as the sellers eventually were depleted.
What Fundamental Signs Pointed to a More Valuable Bitcoin than in November 2018
Such fundamentals includes significant progress in the scaling problem with now more mainstream use of the Lightning network.
Clear signs of blockchain value and increasing interest including the capitulation of blockchain skeptics in the financial industry that have turned around and built their own blockchains, including JPMorgan. Also, some of the big technology companies such Facebook have developed a blockchain cryptocurrency, and Samsung has included a cryptocurrency wallet in its latest device. This signaled that clearly, cryptocurrencies and blockchains are not a fad that is going away anytime soon; at least not in the next year or so.
Signs f real use cases that such as in the remittance industry, which might eventually possibly convert to blockchain technology as illustrated by the IBM-stellar initiative, Coinbase's money transfer feature, and the increasing bank sign ups to Ripple's remittance offerings.
Several smaller cryptocurrency and token offerings were already returning back to pre November 2018 values and higher.
Daily bitcoin transactions continued to increase as well as the daily active user metric; which is one that is frequently used in this blog.
What Next after the Prior Triangle has been Breached?
Eventually, the ascending triangle was breached to around where we currently are today.
And now a new triangle appears to have formed. While some still may not believe that the sudden rise from sub 4,000 to over 5,000 is sustainable and are expecting a pullback, in the past week, Bitcoin has comfortably stayed around and above the 5,000 level. While a pullback may still be in the offering in the medium to long term, another ascending triangle appears to have formed, that's more likely to take the current trajectory to 6,000 with a likely overshoot, than a quick return to mid 4,000 levels.
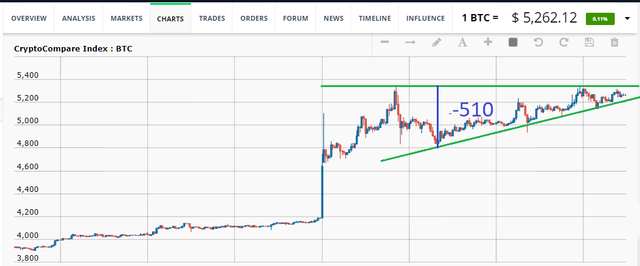
(Source: https://www.cryptocompare.com/coins/btc/charts/USD?p=2W at at 04-08-2019)
So Whats's Wrong with TA Then?
So why critic TAs when using similar tools here?
First, the presentation here is not just about lines and supports but also draws from fundamental factors that point to value.
Secondly, TA should really never be used as a substitute for understanding the value behind the asset. The lines should not be taken as absolutes. And events can and do significantly affect the trajectory of those trends. In addition, the real life circumstances related to development or use of the asset can change the fundamentals causing any expected TA formulation to change. For instance, during the evolution of the descending triangle that got breached at the end of November 2018, if in the six months, some technological development resulted in an obvious enhanced utility in bitcoin utility, then the value might be discerned by holders sufficient to alter the eventual trajectory.
Thirdly, none of the lines drawn by TAs should ever be presented or used absent of a probability analysis and numbers put to possible outcomes. For instance, the first triangle could have been drawn as far back as 11,100 and would have pointed to a low of 1,100 after the triangle breached. However, this was not supported by fundamental analysis of the value as at November 2018, as the daily active users was at late 2017 levels which would not be consistent with a value of 1,100. That would place the probability of a fall that deep very low.
Probability of Bitcoin at 6,000 within the Next Couple of Weeks
So what's the probability that the current triangle will be breached towards 6,000 within the next week or two based on that triangle's trajectory? This requires some assumptions will continue to hold as follows:
the current trajectory of daily transactions and daily active users continue in that trend. There is no reason to expect this to change so the probability of this remains high.
the volume continues to decrease as is characteristic of such ascending triangles. This was also the case for the prior two, and the continued trend bolsters the probability of the ascending triangle break out.
absence of a disruptive event such as failure one of the major stable coins being used on exchanges to enable the cryptocurrency market. A particular concern is that of tethers, which recently altered their terms to imply that the backing for some of the tethers could include loans. Tethers has featured in this blog a few times so we'll not labor the point again here. A major exchange hack could also result in a retracement. Similarly, a major regulatory action restricting cryptocurrencies, similar to he Chine government's early January ban could see also result in a new downward trend.
there is the risk that the slight end of week sell off that frequently occurs on Thursday and Friday, will significantly invalidate the structure and point to a change in attitude and might result in a failure to break above the triangle.
I'll leave it up to the reader to place their own probabilities on any of these events.
Related:
Legal Disclaimer: I am not a financial adviser and this is not financial advice. The information provided in this post and any other posts that I make and any accompanying material is for informational and educational purposes only. Upvote/Resteem/Comment. All comments related to the subject are upvoted. Everyone that resteems gets a 100% upvote on comment here or their own blog. So let's start a conversation. Also join the telegram channel https://t.me/krptofundamentals or Discord at: https://discord.gg/shzKrPh
@kenraphael purchased a 25.07% vote from @promobot on this post.
*If you disagree with the reward or content of this post you can purchase a reversal of this vote by using our curation interface http://promovotes.com
Hope very soon cross the 6k border.
Posted using Partiko Android
As expected, the top of the ascending triangle got breached upwards.