3 Coins to Keep an eye on
Bitcoin is bullish and the global cryptocurrency market cap has been slowly growing over the past month. Many altcoins are still in downtrends, but some are offering long opportunities as they enter significant support levels from which their last major bull runs began.
Here are three altcoins which have events this week and are showing hope for the start of a new bullish trend, depending on how Bitcoin performs over the next week.
1.BitBay(BAY)
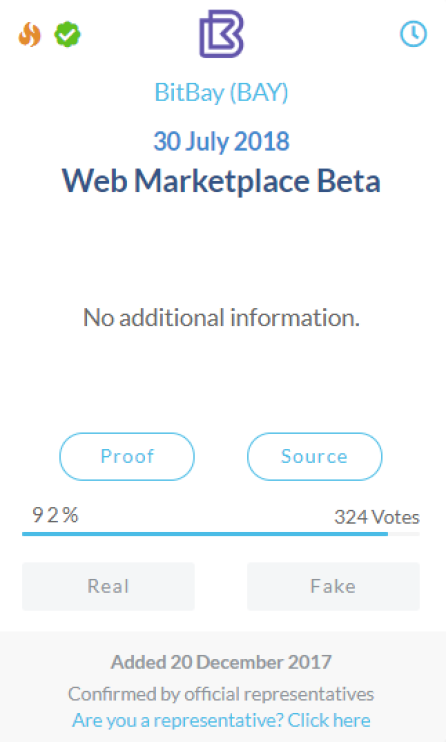
**BitBay (BAY)
https://coinmarketcal.com/coin/bitbay
Price
0.038393 USD (-2.15 %)
0.00000469 BTC (-2.12 %)
Market Cap
38 859 660 USD
4 745.00 BTC
Volume (24h)
120 938 USD
14.77 BTC
Trade
Bittrex, Upbit, Litebit.eu, Cryptopia**
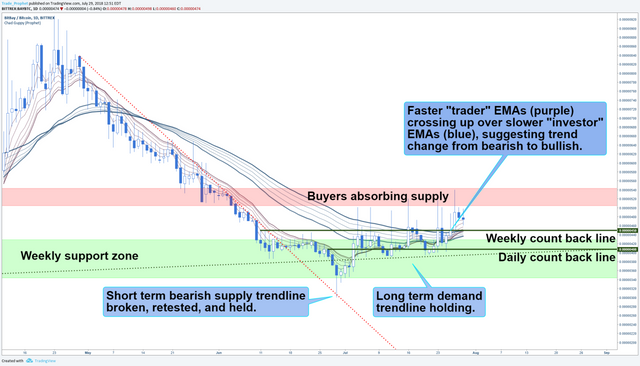
The supply trendline marking the bearish downtrend from late April was broken near the end of June, when price entered the weekly support zone from which the November 2017 bull run began. Price retested and bounced from this supply line, suggesting the end of the downtrend.
In early July, the TD sequential indicator printed an 8 on the weekly chart and a 9 on the daily chart at the bottom of the support zone, which provides entries for aggressive traders on weekly timeframes and medium risk-averse traders on daily timeframes.
Since then, the price has been setting higher highs and higher lows as buyers absorb supply from the resistance above.
Also hinting at a trend reversal on the daily timeframe is the guppy indicator. The guppy’s shorter-term EMAs, which represent speculative trader activity, are crossing over the longer term EMAs, which represent longer-term investor activity. This hints at a trend reversal from bearish to bullish.
Supporting the guppy’s trend reversal hint are the daily and the weekly candle closes over their count back lines. If a timeframe’s candle closes over that timeframe’s count back line then it may be time to begin a long entry.
2.Stratis(STRAT)
**
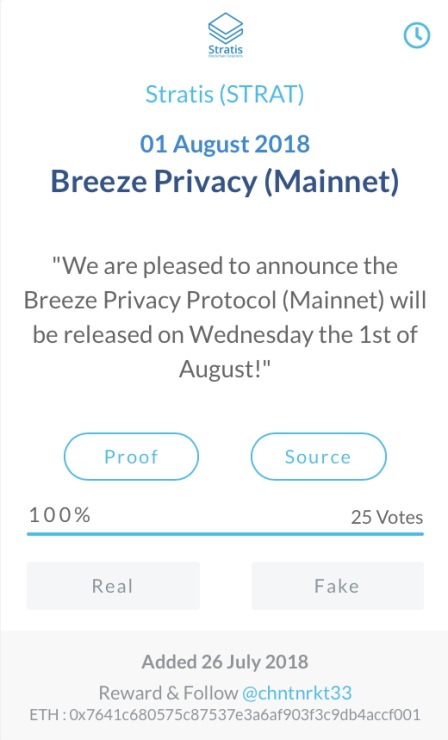
Stratis (STRAT)
https://coinmarketcal.com/coin/stratis
Price
2.92 USD (-0.16 %)
0.00035667 BTC (-0.33 %)
Market Cap
289 139 223 USD
35 305.00 BTC
Volume (24h)
10 711 100 USD
1 307.88 BTC
Trade
Binance, Bittrex, Bithumb, Upbit, Poloniex**
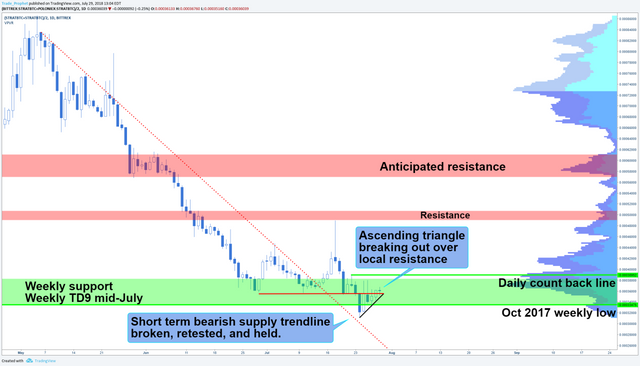
The supply trendline marking the bearish downtrend from early May was broken and retested in mid-July, when price entered the weekly support zone from which the November 2017 bull run began. This suggests the downtrend may be over and accumulation may have begun.
Some hint of at least short-term reversal is shown by a small ascending triangle which formed under local resistance over the past week after price tested the October 2017 weekly low which occurred just before the Q4 2018 bull run began. Price broke out to the upside from this ascending triangle.
More support for a bullish entry is given by the TD sequential indicator, which printed a 9 on the weekly chart in mid-July. This provided an entry for medium risk-averse traders.
This week we will discover whether the ascending triangle breakout will be confirmed by a bounce from the top of the ascending triangle. If price fails to bounce significantly, it will likely form a rising wedge: a bearish pattern that often breaks out to the downside.
A bounce from the ascending triangle and a daily candle close above the daily count back line at approximately 0.000390 would further suggest hope for a bullish trend reversal and provide an entry signal for aggressive traders looking at higher timeframes. A short-term play here could be profitable, but a break of the current level could lead to a significant drop to the next price structure.
3.TRON(TRX)

**TRON (TRX)
https://coinmarketcal.com/coin/tron
Price
0.039879 USD (8.55 %)
0.00000487 BTC (7.51 %)
Market Cap
2 621 982 094 USD
319 973.00 BTC
Volume
302 121 000 USD
36 869.25 BTC
Trade
Binance, Upbit, Bithumb, OKEx, Bit-Z**
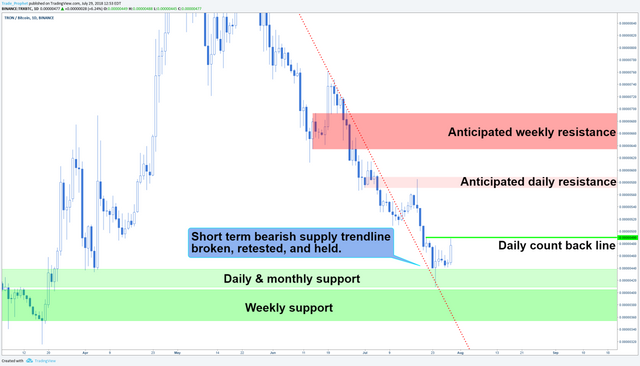
TRX’s supply trendline marking the bearish downtrend from late May broke in mid-July, when price began entering bullish order blocks from April’s bull run. Similar to BAY and STRAT, price also retested and bounced from this supply line.
Last week, the weekly TD sequential indicator printed a 9 that provided a buy signal for medium risk-averse traders. At the same time, price violently bounced from the monthly and daily support structures just above the weekly level from which the March-May bull run began.
A daily candle close above the daily countback line at approximately 0.00000490, which price tested once last week, will provide further hope for a trend reversal and provide a long signal for aggressive traders.
More risk-averse traders may wish to wait for a candle close to mark a higher high between 0.00000570 and 0.00000590, or else for a drop to stronger weekly support levels under the current price.
** Loved it? Resteem it**
Congratulations @preetisingh1993! You have completed the following achievement on Steemit and have been rewarded with new badge(s) :
Click on the badge to view your Board of Honor.
If you no longer want to receive notifications, reply to this comment with the word
STOPTo support your work, I also upvoted your post!
Congratulations @preetisingh1993! You have completed the following achievement on Steemit and have been rewarded with new badge(s) :
Click on the badge to view your Board of Honor.
If you no longer want to receive notifications, reply to this comment with the word
STOP