BTC Update 3-11-18: Bears Come Out to Play
Price: ~ $8,700
In previous update’s I’ve combine the daily mega pitchfork, cloud, & EMA’s however the charts are beginning to clutter, for sake of clarity, I’m separating them. Also in today’s piece, I will be introducing a new chart to the daily repertoire!
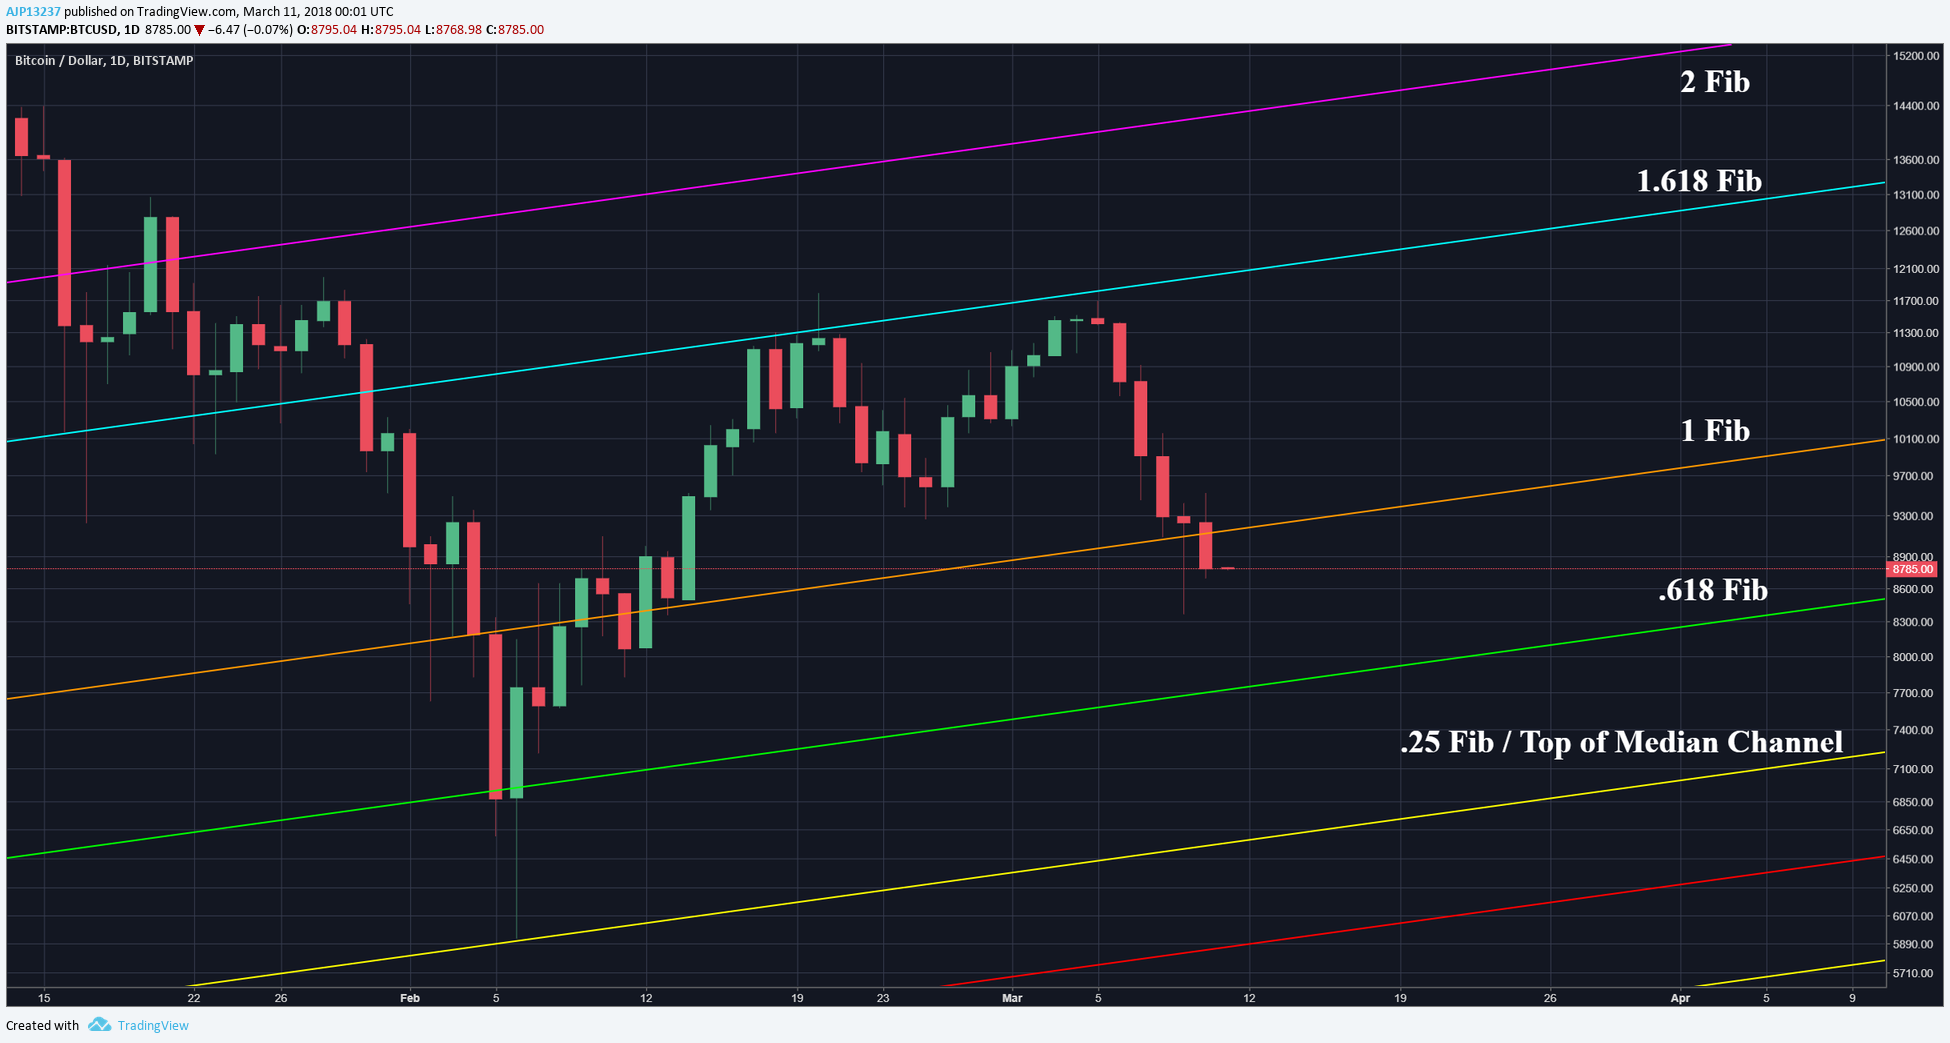
Mega Pitchfork:
On the daily pitchfork BTC was stopped by the 1.618 fib, creating a double top, resulting in a drop to the 1 fib. BTC managed to close above the 1 fib, but was unable to hold support for consecutive days, resulting in breaking the 1 fib as well. BTC will need to close above the 1 (~9.2) to reclaim the 1 fib otherwise will now be a new resistance & support not until .618 fib (~7.7).
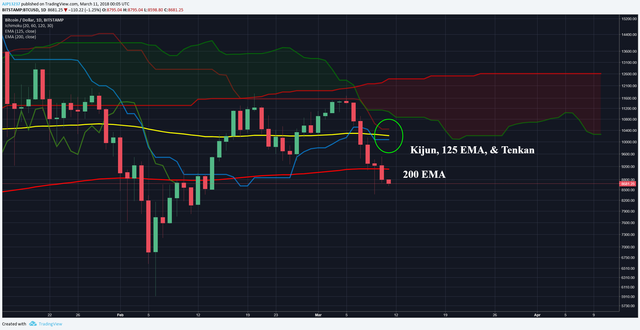
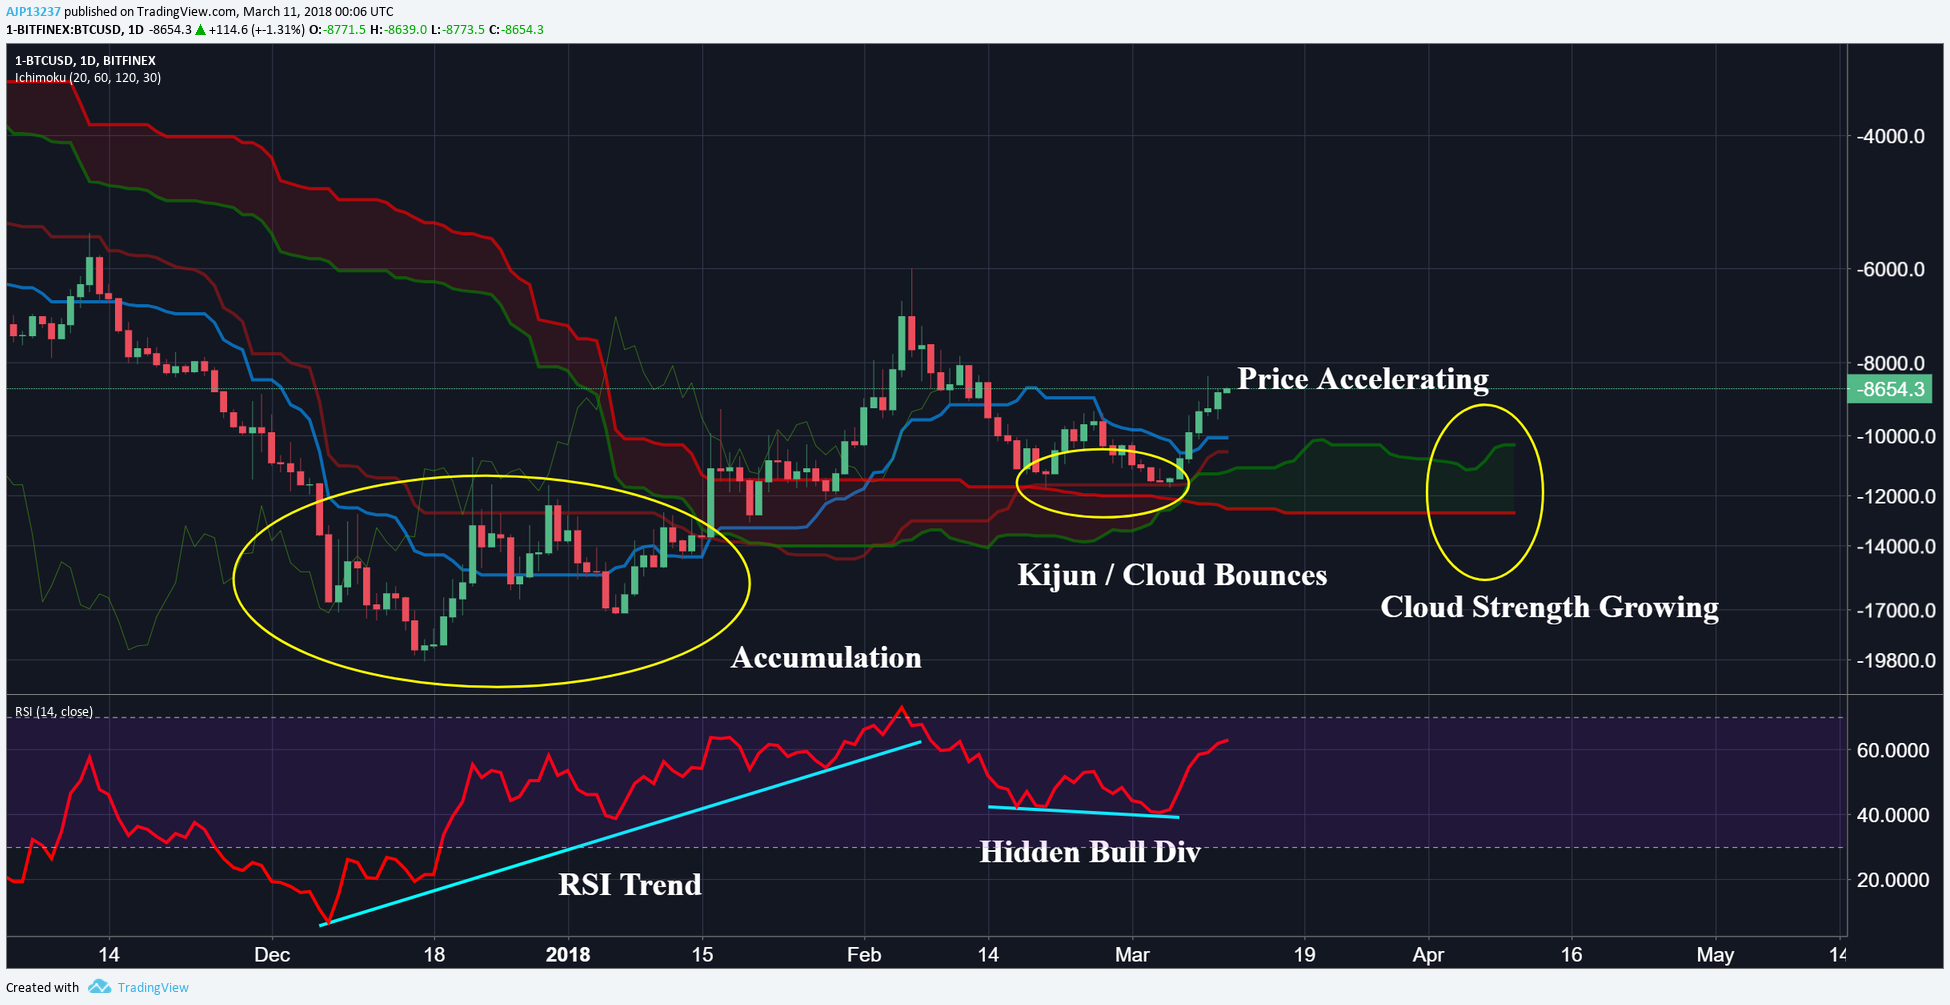
Daily Cloud:
On the daily cloud, the double top was stopped by the cloud resistances and has re-broken all immediate supports in this range. Like the 1 fib, the 200 EMA (~9.2) will need to be re-claimed, otherwise will be hard resistance again. Finally, there is a confluence of resistance building around 10-10.5K region with the Kijun, 125 EMA, & Tenkan aligning around there, meaning if BTC does find its legs, this will be strong resistance to crack through, and could be a rejection zone.
12HR:
The 12 hour cloud has been a strong indicator for the immediate BTC trend. On the way up from $6K, it was alluded in a few updates as a zone of strong contention between Bulls & Bears. Let’s review:
- First time price entered the 12HR cloud it began to have trouble.
- Began finding support near the bottom of the cloud
- Price stopped by the top of the cloud
- Edge to edge move to bottom of the cloud
- Break cloud, failed re-entry
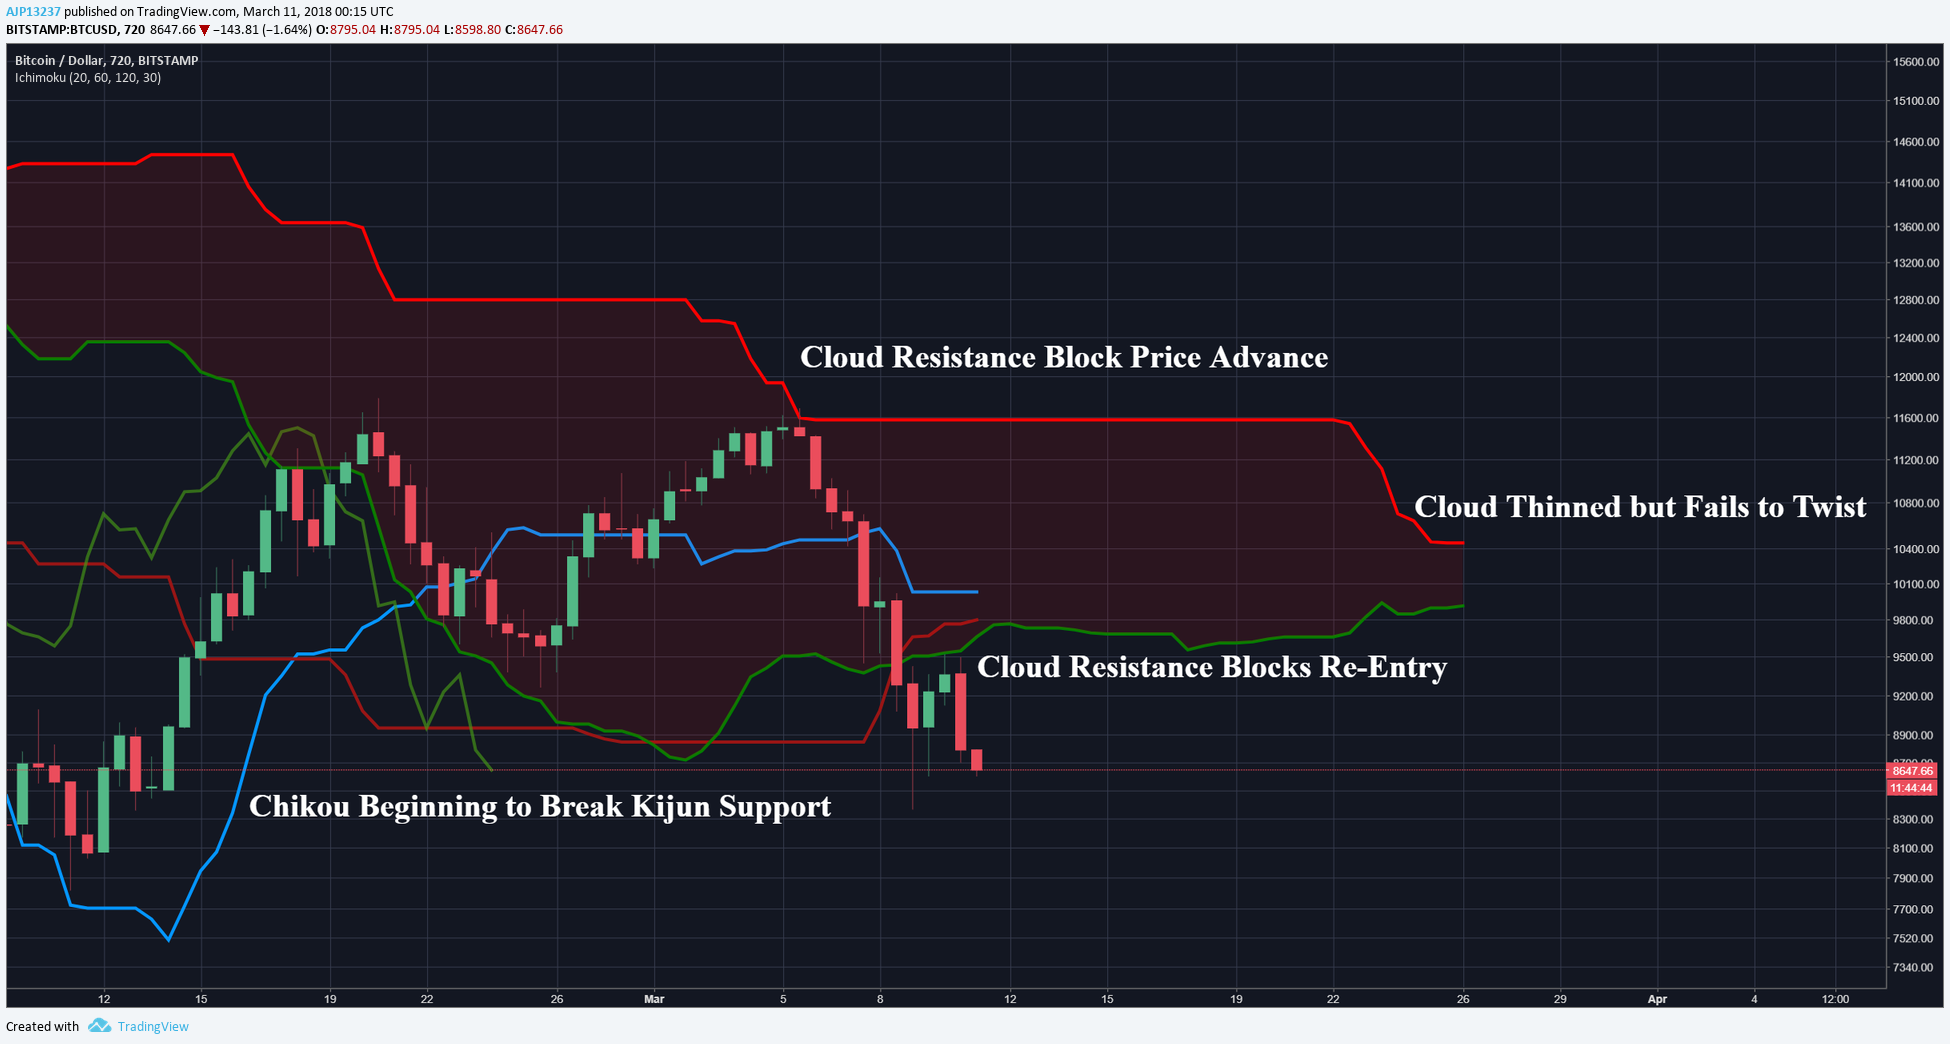
Furthermore, the Chikou, which is the lagging price indicator is failing to find support on the Kijun & the cloud that was beginning to thin but has halted in the interim. As of this moment the last remaining bear signal is the TK’s re-crossing, if & when this happens, the 12HR cloud will be dead as support & full on resistance again.
EMA Cross Follow-up:
For those unfamiliar with the EMA follow-up section; BTC shares similarities with the 2013 & 2014 pullbacks in that they were large & drawn out enough to cross the 25 EMA (Fastest) & 100 EMA (Medium) and needed to find support around the 300 EMA or lower. In 2013, there were no further crosses & once price and EMA’s properly re-crossed there was bull continuation. However, in 2014 the 25 EMA crossed with the other EMA’s and eventually price followed for bear continuation.
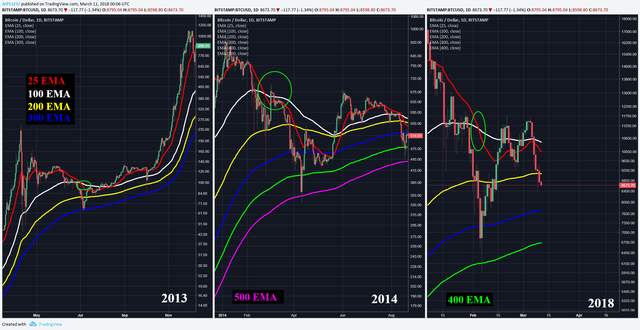
Up until recently the 25 EMA looked like it was attempting to re-cross with the 100 EMA, teasing the possibility of a 2013 bull continuation. However, the re-cross has failed for the time being and the 25 EMA is beginning to curl down again. In previous update’s it was also mentioned a FUD event (Binance hack/SEC crackdown) could cause a re-trace to the 300 EMA (~7.6), as it did in 2013 right before bull continuation. However, that was also after the bullish re-cross and price back above the 25 EMA, neither has happened here. Finally, as mentioned earlier, price fell through the 200 EMA and until price re-closes above, will be resistance.
Looking ahead, the signal to be on the lookout for is if the 25 EMA crosses with the 200 EMA. In this scenario the 25 EMA (Fastest) is not only getting mixed up with the 100 EMA (Medium), but also the 200 EMA (Slower), which would be a strong indicator for bearish continuation. It’s too be determined if BTC can avoid this scenario, but the longer price stays below the 200 EMA, the more likely it is becoming.
Inverse Daily:
Finally, the new chart! If we are truly in a Bear market & cloud was a strong indicator during Bull trend. It may be time to start considering the cloud as strong support for a Bear trend. Below is the inverse price of BTC on the daily. It’s also too be determined if the chart will continue to play out, but in the interim, it’s showing strong indicators of bullish momentum (which would be bearish for price). If price is unable to find bottoms between $6-9K, this may be the short chart to be following in the immediate future.
Prognosis:
The Bear swell continues to be strong as BTC continues to break important support levels (200 EMA, Daily Tenkan & Kijun, pitchfork fibs, 12HR cloud) that were shortly rebuilt. The longer price stays below $9K, the more likely the Bears will continue to have hold of the market. In the event BTC finds a bottom, strong resistance in the medium term is around $9-9.5K and $10K+ longer out. In the event bears continue to drag price down, next support zone is around $7.6-8K (.618 fib, 300 EMA).
If at any point you find these charts too small to read or want to zoom in, simply right click on the chart & open in new tab for full view.
If you found this useful & educational, please like, share, & follow.
steemit: @ dogevader
twitter: @ Noob_Charts
Finally, if you have any questions or comments, leave them below & happy trading!
Hi @dogevader thanks for updated chart!
For future viewers: price of bitcoin at the moment of posting is 8676.80USD
For future viewers: price of bitcoin at the moment of posting is 8662.70USD
For future viewers: price of bitcoin at the moment of posting is 8617.00USD
spot on
Dogevader; on point at a level that makes Nostradamus jealous.