BTC Update 4-28-18: Cloud Odyssey Begins
Price: ~$9,400
In last week’s update the focus was on the similarities in the 12HR cloud between February & April. Since then, BTC broke through the 12HR cloud & finally back into the Daily cloud for the first time since February. The 12HR cloud may once again help given some insight on what to expect next from BTC on the Daily, so let’s begin there.
12HR Cloud:
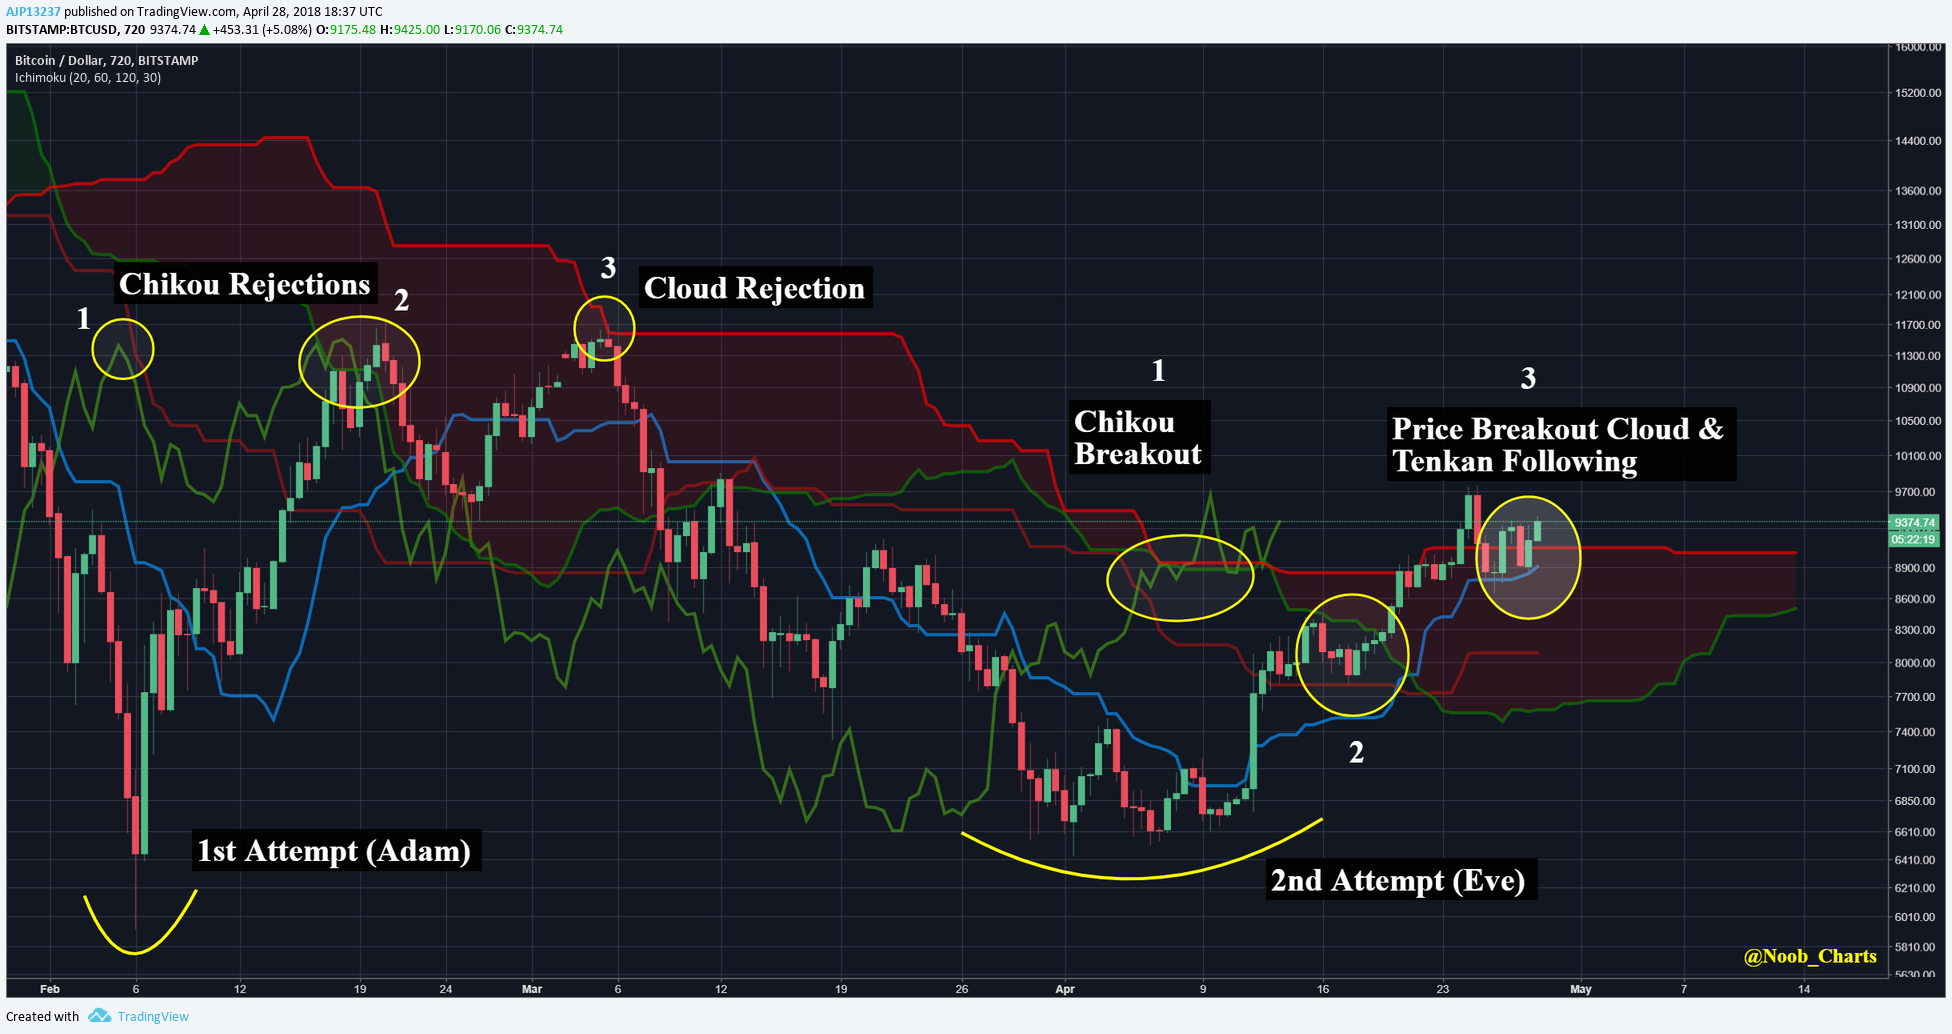
As alluded above, BTC completed the edge to edge move & eventually broke through the 12HR cloud. Notice the subtle differences between attempts 1 & 2, these will be important for explaining the Daily later.
Step one:
Attempt 1: The Chikou (past price indicator) ran into the Kijun & found rejection there.
Attempt 2: The Chikou is allowed to pass through the Kijun & eventually through the cloud. Also notice the Chikou retest of cloud support.
Step two:
Attempt 1: Price enters the cloud, but Tenkan & Kijun are far and don’t retest, price makes slide down cloud and sets up edge to edge move.
Attempt 2: Price breaks through cloud & does not need to retest bottom of cloud, Tenkan & Kijun are close & begins to follow & support price.
Step three:
Attempt 1: Cloud rejection, edge to edge back down & re-break cloud. Tenkan remains flat & unable to support price before eventually breaking down as well.
Attempt 2: Price breaks through the cloud, Chikou finds support on retest of top of cloud & is free of resistance, & Tenkan rises to support price.
Attempt 2 on the whole is clearly more organized, healthier, and displays textbook cloud mechanics. Now keep in mind these “healthy” mechanics you’d want to see from price & cloud when we observe the Daily cloud. Finally, notice there is a “Cloud Cliff” around $11.5K+, which indicates a heavy resistance zone, for more on Cloud Cliffs, read here under 2HR.
Daily Cloud & Mega Pitchfork:
After bumping back into the Kijun, not since mid-March, BTC was finally able to break past the Kijun & back into the daily Cloud for the first time since February. While this is accomplishment for the Bulls and easy to assume an edge to edge cloud move is bound to happen; it’s still best proceed with cautious optimism for a few reasons.
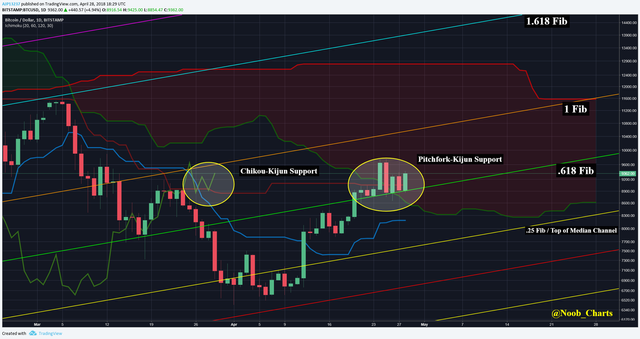
- Future cloud projection remains bearish with heavy resistance $11.5K+.
- The Tenkan has not begun to rise & A bullish Tenkan-Kijun cross has not occurred yet & even if does occur, will likely be below the cloud, which is the weakest cross.
- Chikou is blocked by Cloud resistance $10.5K+.
This said, remember from above in the 12HR cloud, if BTC can continue to hold the 9K price range long enough for the Tenkan to begin rising as support, the more likely a bullish Tenkan-Kijun cross becomes and later setting up a potential edge to edge move. In the event that BTC falters, the bottom of the cloud & Tenkan (low $8K’s) will be relied on for support.
EMA Follow-up:
For those unfamiliar with the EMA follow-up section; BTC shares similarities with the 2013 & 2014 pullbacks in that they were large & drawn out enough to cross the 25 EMA (Fastest) & 100 EMA (Medium) and needed to find support around the 300 EMA or lower. In 2013, there were no further crosses & once price and EMA’s properly re-crossed there was bull continuation. However, in 2014 the 25 EMA crossed with the other EMA’s and eventually price followed for bear continuation.
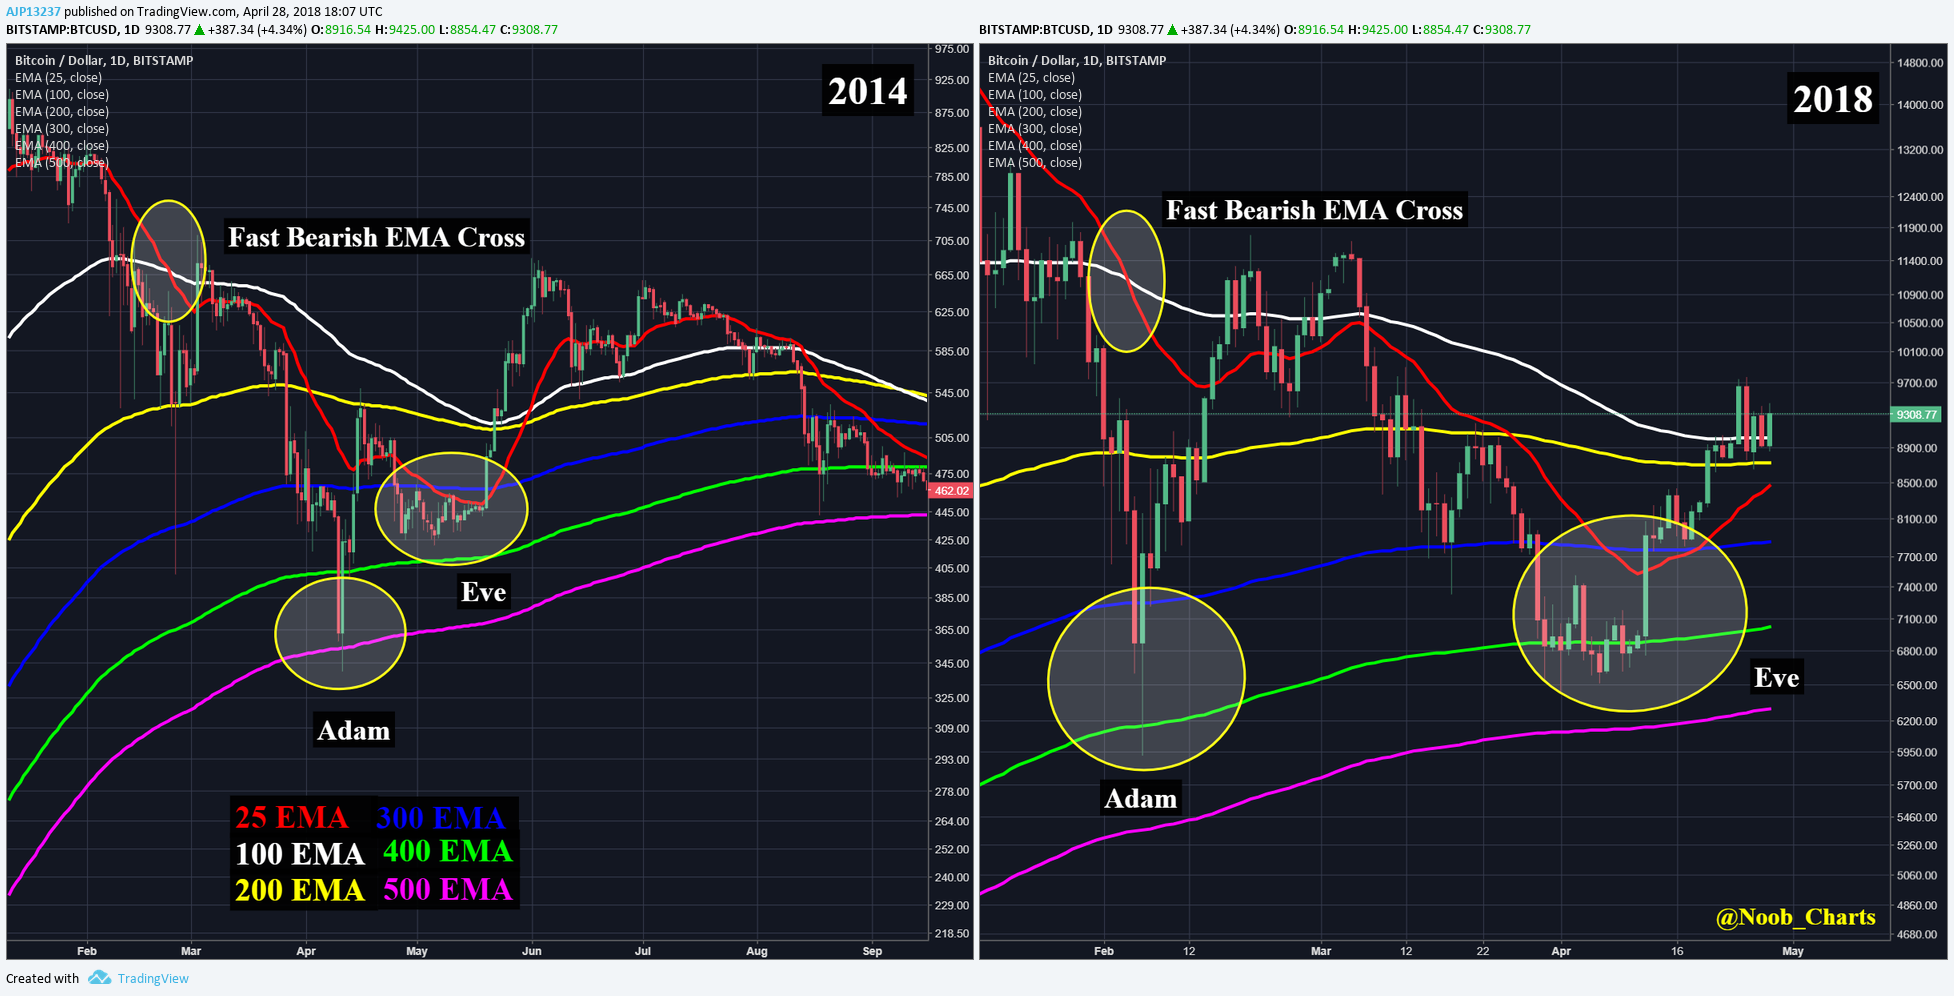
At the beginning of April I had declared the 2013 setup to be dead and don’t feel it is necessary to continue charting it. Now that we can focus primarily on 2014 & 2018, it’s easy to see the similarities; however the differences may paint a different outcome this time around.
Notice in 2014, price needed to test the 500 EMA, in 2018 only the 400 EMA. In 2014 BTC’s journey back up on its first attempt, it was unable to get past the 200 EMA, in 2018 broke past the 200 EMA & even briefly peaked past the 100 EMA.
They both share a similar Eve bottom around the 400 EMA, however BTC’s journey this time up has been slower & possibly even much healthier because of it. In 2018 that the 25 EMA is beginning to creep back up & attempt to re-cross bullish. The longer that BTC remains above the 25 EMA, the stronger it will become. However, also notice in 2014 where the Bearish EMA cross occurred ($666!), became the hard resistance for price on the way back up and eventually spelled doom for price. The Bearish cross in 2018 is around the ~$11.5K level and has already proven tough for price once on its attempt in February.
Prognosis:
BTC has been enjoying a slow & steady climb back into the $9,000’s & Daily cloud. While it’s easy to believe that Bitcoin is back, cautious optimism recommended. Multiple confluence of indicators show heavy resistance beginning around $10.5K with heavier resistance awaiting around $11.5K. If BTC falters, there is growing support in the low $8K’s.
If at any point you find these charts too small to read or want to zoom in, simply right click on the chart & open in new tab for full view.
If you found this useful & educational, please like, share, & follow.
steemit: @ dogevader
twitter: @ Noob_Charts
Finally, if you have any questions or comments, leave them below & happy trading!
love your reports...
I really don't know why don't you have more followers...