BTC Update 5–16–18: The Eye of Consolidation
**Disclaimer- Due to technical difficulties, I was not able to post this update on Steemit a few days ago, the original post can be found on Medium . I am posting the update here as well for continuity, nonetheless the analysis remains unchanged.
Price: ~$8,300
In the previous update BTC was entering the Daily Cloud for the first time since it broke out of the Cloud in February; cautious optimism was recommended as we approached the $10K level and technical indicators pointed to support in the low $8K’s. Since then BTC had trouble getting past $10K and has been consolidating in the low $8K’s for the past several days. Let’s investigate to see where BTC is heading to next.
12HR Cloud:
The 12HR cloud has been a reliable indicator for BTC for the past several months. In last update BTC was beginning to break past the cloud. Since then, BTC managed to break out of the cloud but ran out of steam, completed an edge to edge to bottom side of the cloud, Kijun rejections, and has re-broken cloud support.
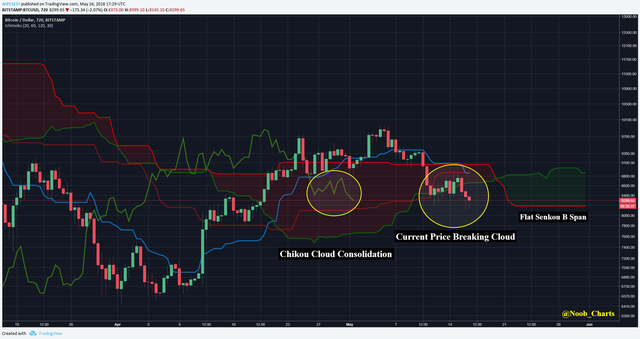
This said, it’s not all gloom & doom just yet. Observe that the Chikou, past price indicator, has been consolidating inside the 12HR cloud & has yet to break Kijun support. This means that while current price is having difficultly at these levels, past price has created enough support at these levels to avoid automatic free fall.
The future cloud projection has also painted bullish through the end of May, with a flat Senkou B span around current price levels. The flat Senkou B span is significant for a few reasons. To begin, let’s review what the Senkou B span is; Senkou B span represents the equilibrium between the highest high & lowest low of price during the long span and is typically a strong area of support or resistance.
The formula is as follows:
Senkou B= (highest high & lowest low both over 120 periods)/ 2
Now let’s bring it all together and see what this means for BTC. If the Chikou, remains above the Kijun long enough, current price will be creating a bridge to the Senkou B span and begin to create strong support in the low $8K’s. However, if the Chikou falters, the next alignment for support is the bottom of the 12HR cloud ~ $7.5K, then if BTC manages to find a bounce there, the Senkou B span would become hard resistance in the low $8K’s. Finally, also observe if BTC does manage to find support in this low $8K region, that the Chikou is blocked by candles & cloud resistance ~$8.8K+. In brief, with the Chikou inside the 12HR cloud & current price broken the cloud, BTC is confirmed in full consolidation mode & will be relying on cloud support & resistance levels in the coming weeks.
Daily Pitchfork & Chikou:
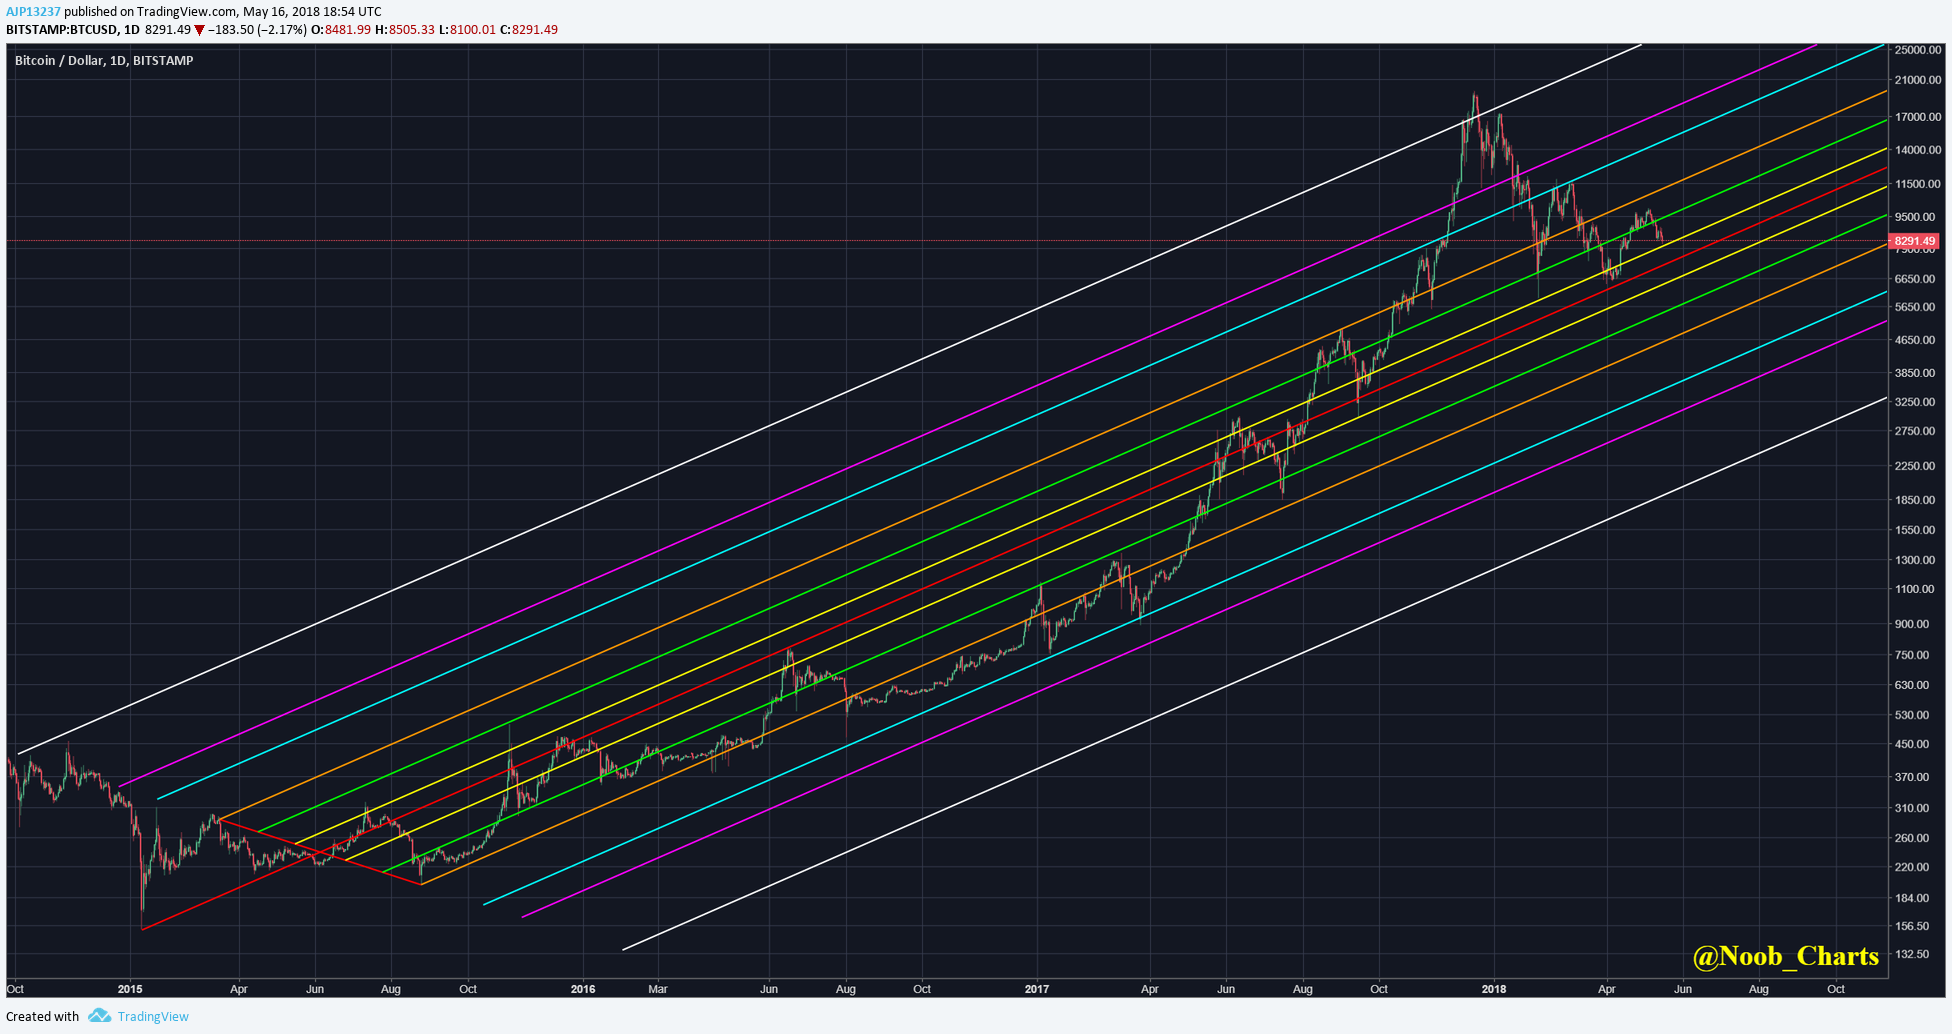
As I’m sure many have already seen on the Daily cloud, BTC is at the bottom of the cloud, rather than focus on the Cloud itself, I’d like to focus on the Chikou in relation to pitchfork fibs. For those unfamiliar, the Mega Pitchfork Fib is a personalized indicator and has been a reliable source of Macro support & resistance levels since the inception of the 2015 Bull Run. If you take the time to observe closely, BTC likes to ping off these support & resistances levels frequently.
Here is the zoomed in look at current price with the Chikou as overlay. Notice on BTC attempt past the .618 fib in early May it began to stutter. This is because the Chikou was unable to move past the 1 Fib after a few tries, in other words, BTC was not ready to take on these resistances levels just yet. Since then, the Chikou completed an edge to edge back to the .618 Fib & is currently consolidating on candles.
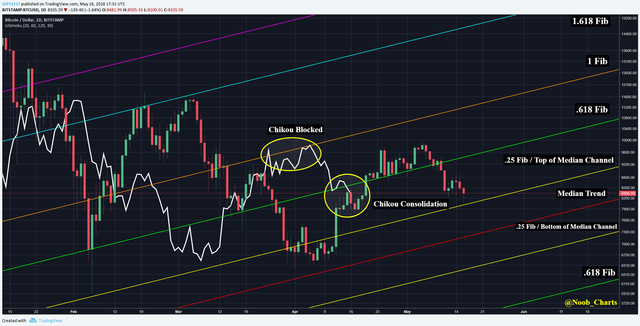
Meanwhile current price fluttered with the .618 Fib and it remained support on BTC’s up thrusts, until it ran out of steam and broke the .618 Fib. Price is currently attempting to find support on the .25 Fib or the top of the Median trend.
In the coming days, it will be important to pay attention to how the Chikou responds to the .618 Fib & candles it’s consolidating on. The longer the Chikou remains under the .618 Fib, the stronger that resistance grows. If this support holds, look for current price to make another attempt for an edge to edge back to the broken .618 Fib, which will be hard resistance ~$9.2+. In the event, that BTC continues to slip, retesting of the Median trend ~$7.5K is in the cards.
Inverse Daily:
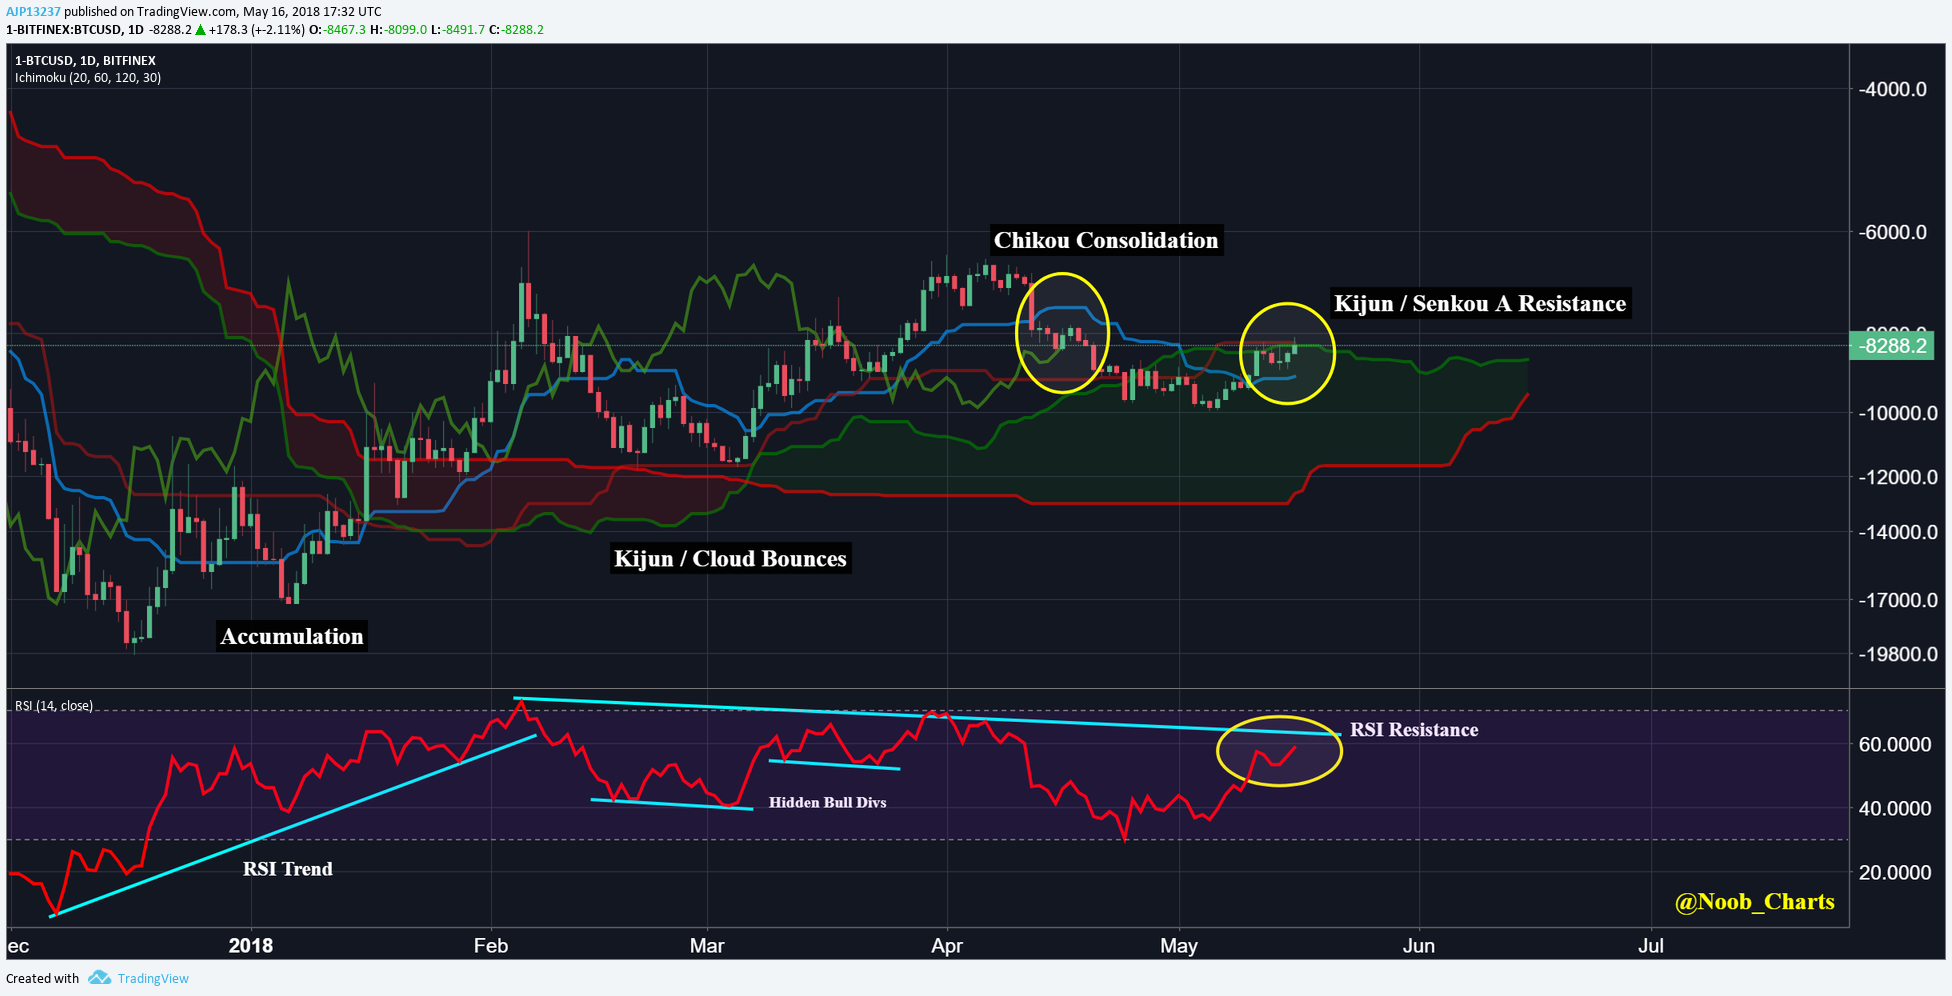
It’s been a few months since a formal update of the inverse chart. At the time, Bears were gaining momentum for their second run for the $6K’s, since then price re-entered the cloud, found support inside the cloud & is attempting to break out of the cloud. Like we reviewed Senkou B Span, it’s important to review Senkou A span and their differences.
Remember that Senkou B Span, only takes the highest high & the lowest low of price during a given period of time, this is often why the cloud will be flat and is deemed “hard” resistance or support. Senkou A Span, does not only take the highest high or lowest low or price, rather it is taking the average of Tenkan & Kijun at any given point, hence creating a more jagged and soft shape to the cloud.
The formula is as follows:
Senkou A= (Tenkan + Kijun )/ 2
Currently the Bears have regained the Tenkan as support and are blocked by the Kijun & Senkou A, but as mentioned, this is a soft resistance and if the Bulls are not strong enough to defend, will lead to a Kumo breakout for the Bears. This said, the theme of the update has been Chikou consolidation; at the moment, the Chikou is consolidation on the candles & has Tenkan resistance in front of it as well. Only if these become violated & the Chikou becomes free of resistance is when the Bears will be able to truly breakout. Finally the RSI is right under resistance levels, a confirmed breakout will give Bears momentum for another leg.
EMA Follow-up:
For those unfamiliar with the EMA follow-up section; BTC shares similarities with the 2013 & 2014 pullbacks in that they were large & drawn out enough to cross the 25 EMA (Fastest) & 100 EMA (Medium) and needed to find support around the 300 EMA or lower. In 2013, there were no further crosses & once price and EMA’s properly re-crossed there was bull continuation. However, in 2014 the 25 EMA crossed with the other EMA’s and eventually price followed for bear continuation.
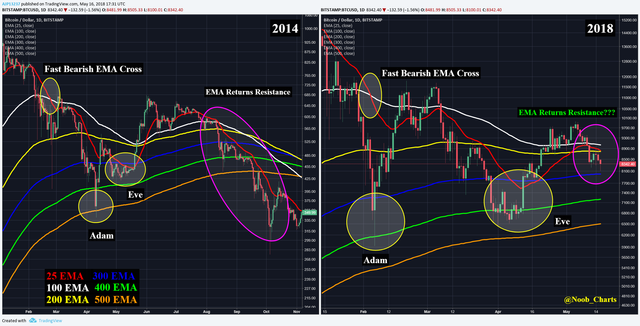
At the beginning of April I had declared the 2013 setup to be dead and don’t feel it is necessary to continue charting it. In the previous update the focus was on the similarities (yellow circles) & contrasting the differences developing between 2014 & 2018.
At the time of the last update, the 25 EMA was creeping closer to the 100 EMA & teasing a bullish cross. However, like in March when it teased bullish, it was unable to re-cross bullish again. Since then, the 25 EMA has begun to creep down again. Observe in 2014 (purple circle), when the 25 EMA began re-crossing bearish with the other EMA, it became a hard resistance for price to overcome for months. In present day, the 25 EMA has begun acting as resistance again & now price has a confluence of resistances $8.8K+ with the 100 & 200 EMA’s. Currently price is hovering around the 300 EMA, which is beginning to shape up as a heavily tested zone (February-April). It’s still too early to call BTC full on 2014; there will need to be more bearish EMA crosses, but the longer it stays below the 25 EMA, the weaker current price becomes.
Prognosis:
Since its revival from the mid $6K’s last month, BTC had been enjoying a steady climb back up, however clearly ran out of steam for more upward momentum. BTC is now in consolidation with the Daily cloud offering it support in the low $8K’s. If BTC does find enough steam for another move back up, there is growing resistance at $8.8K. In the event that Bulls falter, look for support beginning in the mid $7K’s.
If at any point you find these charts too small to read or want to zoom in, simply right click on the chart & open in new tab for full view.
If you found this useful & educational, please like, share, & follow.
steemit: @ dogevader
twitter: @ Noob_Charts
Finally, if you have any questions or comments, leave them below & happy trading!
Hi, thank you for contributing to Steemit!
I upvoted and followed you; follow back and we can help each other succeed :)
P.S.: My Recent Post
Congratulations @dogevader! You received a personal award!
Click here to view your Board
Congratulations @dogevader! You received a personal award!
You can view your badges on your Steem Board and compare to others on the Steem Ranking
Vote for @Steemitboard as a witness to get one more award and increased upvotes!