Why BTC Will Be Trading Over $800 Or Under $500 By This Time Next Week
Out With The Old In With The New
As I was mentioning to the viewers in my latest vlog for DashPay Magazine, I expected that the Halving would be a non event on the day of the reward adjustment but that I expected early next week to start seeing some significant fallout by way of volatility. For traders volatility is a good thing, and until recently that volatility has been very predictable as we can see in the following chart:
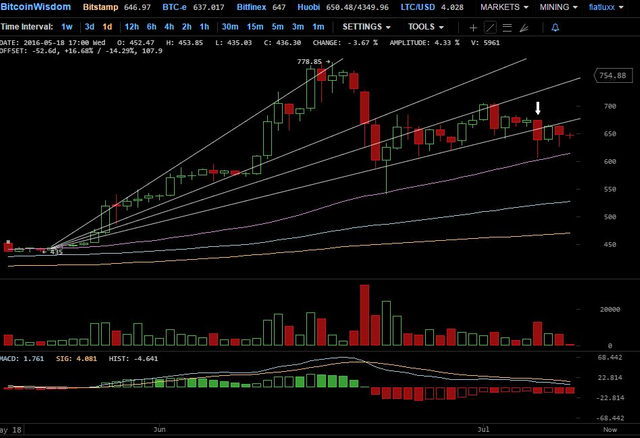
As you can see the price of BTC has been in an upward channel for almost two months. The only deviation from this channel happened on June 22nd where we broke down to the 50 day moving average (DMA). It’s important to note that we only spent a part of one day outside the channel and reflexively shot back to close the day within the channel.
This time is clearly different. On July 6th (see arrow) we broke down and were saved by the 50 DMA but closed outside the channel, As of this writing we have not reentered the channel, suggesting that a new trend is forming.
Coiling Like A Snake Ready To Strike
As we can see from the following chart, that July 6th breakdown did in fact break the old pattern and begin forming a symmetrical triangle pattern. This type of triangle pattern is a consolidation pattern where the price coils in anticipation of a strong move beyond one of the trendlines.Technically, this could break either way but I am going to suggest to you that the path of least resistance is up.
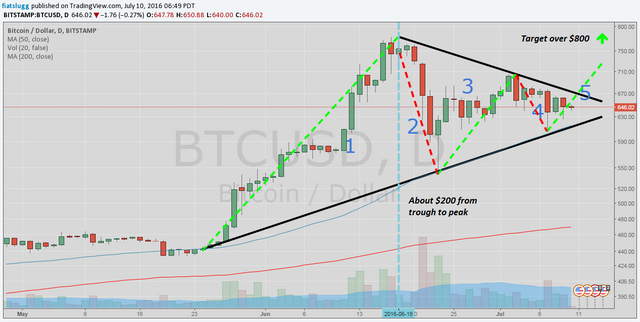
There are a lot of things going on in this chart that I would like to explain. First, is the 5 wave structure count that I have highlighted. The green lines numbered 1,3 and 5 are called impulse waves while the red 2 and 4 are called correction waves. I suggest that we are currently getting ready to begin the wave 5 impulse which should break the triangle to the upside.
Target over $800
While it’s impossible to predict exactly where the price will end up after the triangle breaks; mostly because we don’t know exactly where the break will occur, we can use some guidelines about the structure of the triangle to come up with a likely range. If you notice the blue line going vertically that forms the base of the triangle; we calculate about $200 measuring from peak through trough. This value is helpful to us in that we can add that number to the price at which the triangle breaks, in either direction, to measure the likely target. In our case that would be in the $850 range to the north and $450 dollar range to the south.
Conclusion
While the most likely target I’ve outlined for the coming price of BTC is in the $800 to $850 range there is a possibility we could break down to retest the $450 area. That breakdown scenario is unlikely because of the internal wave structure as well as the 50 DMA has been tremendous support for several months. Whatever happens the next month should be incredibly volatile altering not only BTC but many of the Alt Coins that pair with it.
** If you have found this article useful, please consider upvoting so that I can continue to provide regular updates, cheers!**
About the author
Aaron CasillasAaron’s first real job was at the world renowned Capital Group where his mind was blown by an emerging technology called the internet. He has followed capital markets for nearly two decades and now devotes most of his time to technical analysis in the crypto space, boxing and his day job as a wellness coach.
Thank you. Please post more of these
You're very welcome, and yes I will post more. Please consider following me so you don't miss any of my posts.
An absolutely magnificent post, carrying the sort of title that almost always ends up with zero raw, traditional, or even logically speculative evidence to reinforce whatever claim(s) they made.
You covered all of that, and then some; Thank you for taking the time to put truly high-quality content on here for us!
Signed,obfuscate-meI really appreciate the kind words, I love writing for Steemit exactly because of people like you. Cheers.
Thank you for your analysis.
Thanks for the reply and you are welcome. Please consider following me to stay updated on my work.
Thank you for posting this! i was nervous and hoping the price will go up 700$ in 2-3 days, now after reading it im much more calm:)
Glad I could help! Of course anything can happen but in my opinion this is the path of least resistance.