Bitcoin has bottomed. Here's the proof.
As I've written on previous articles I think cryptocurrency exchanges are utterly useless for getting any decent info about the network or the state of the market.
The reason is that most of the volume is occuring off-exchange via P2P and OTC brokerages.
This means that exchanges are NOT REFLECTIVE of actual market volume and subsequently their price signalling is completely screwed up.
Lets get into this, firstly, if you look at exchange volumes, you might be misled into believing trade volume was drying up.
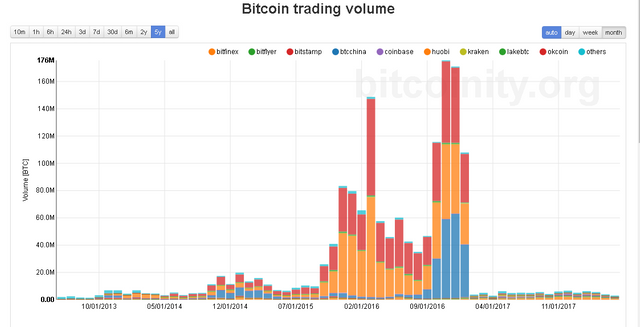
However, this is pure BS.
Trade volume and Exchange volume are two radically different things which are often confused with each other. Likewise, total volume of the network (Network Transaction Volume) in itself is a different beast.
Lets compare de facto transaction confirmation volume from the Bitcoin network (blue) with combined exchange volume from popular exchanges (red).
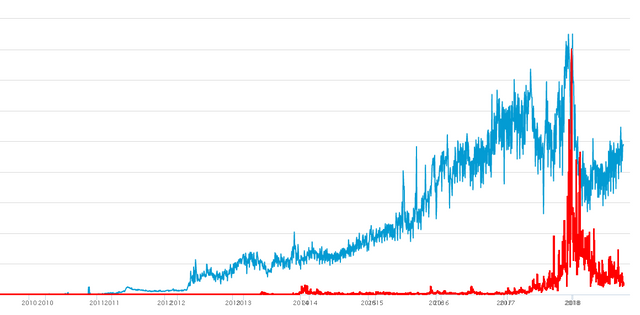
Okay, this is a more interesting picture surely right?
So we can discern the following from this:
- Bitcoin isn't dying. Exchanges are dying.
Look at the period which begins with the Q1 2018 crash. You'll notice that the volume of bitcoin exchanges goes into terminal decline. Indeed, if you compare this with the total network transaction volume, you'll see that they begin to diverge in extremis.
One reason is why TA on bitcoin can be difficult is because ultimately, we still reference exchanges for price... when most of the volume is actually occurring off-exchange (via P2P/OTC/Etc. sources).
So how does total network transaction volume fit with BTC price performance?
Well...
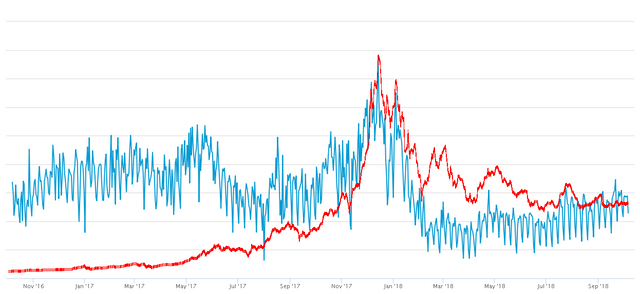
(Price in red, volume in blue).
The fit is very good. As a matter of fact you can see spikes and waves and downturns clearly reflected in the volume.
Moreover, there are a couple of other interesting points.
First lets divide the chart into two parts.
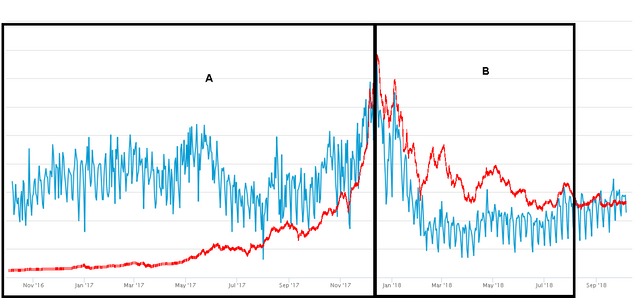
In part A, the main observation is that network transaction count exceeds price.
In part B, the main observation is that price outperforms network transaction count.
Moreover, the point in the middle where the collapse actually begins is where transaction volume and price converge on our charts.
This seems like an obvious issue of supply and demand relative to price. In short, when demand is outperformed by price, that's when we're likely to see collapse. By this definition then bitcoin was overbought significantly throughout all of part B and could be said to be oversold through most of part A.
So really this is another factor in why the collapse occurred. An exodus of transactions from the network as a whole.
Now, a 2nd interesting point bearing in mind the above is that if we look at the chart, we can see that transactional throughput has once again caught up to price. as seen in Part C.
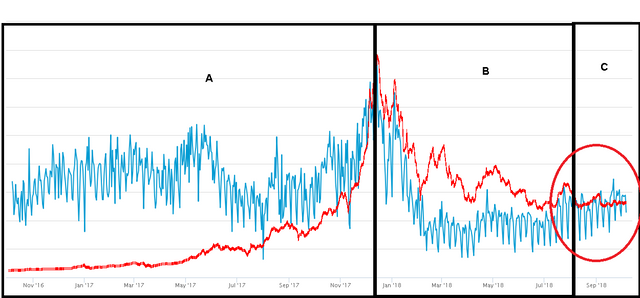
This suggests that the market is readying itself for another return to appreciation. I doubt we'll see an immediate spike, however, to me this proves that bitcoin has bottomed and is at prime buying time.
Thanks! Resteemed!