Tradingview: Bitcoin Chart Review and Update #4 ?
BTC Chart Published By Philosof at TradingView
https://www.tradingview.com/u/Philosof
Bitcoin chart review
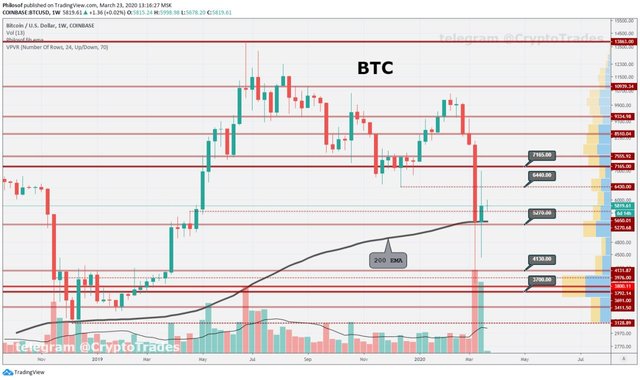
Bitcoin 1week Chart
S&P 500 Chart
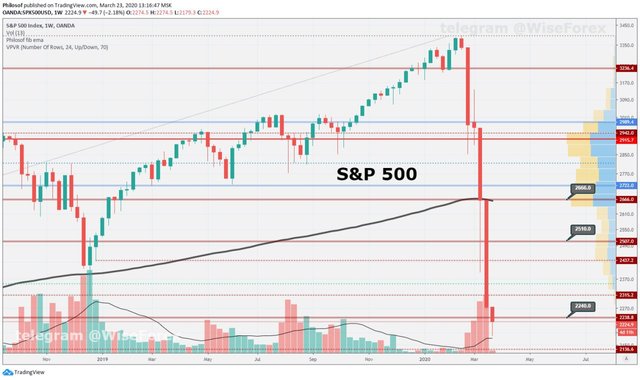
Comment: Another week left in the past. Dead cat bounce finished, now we may expect either continuation of the dump, or another week of consolidation with huge trade range. Dump scenario is highly possible and hint for it may be found in S&P500 chart that show stock performance of 500 largest US companies. Compare it with BTC week chart. Bitcoin isn't doing that bad at all, but it is hard to expect any kind of bullishness, while world economy is collapsing.
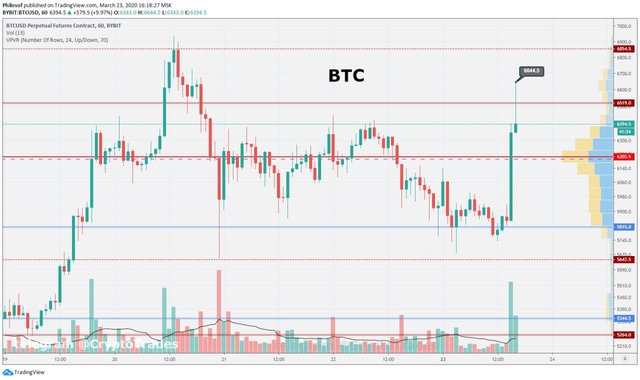
Bitcoin hit all marked resistance levels in one hour candle. Next strong resistance levels are at 6900 and 7170. But before growing higher, BTC can pull back to 6100-6200, so don't rush in fomo.
Fear & Greed index: 10 (<= 11 <= 9 <= 9 <= 12 <= 11)
BTC Dominance: 65% (<= 65.1 <= 65.1 <= 64.9 <= 64.3)
24h Volume: $132 billion (<= 130 <= 187 <= 185 <= 124)

If You Like This Post Upvote,Resteem and Follow Me