BTC
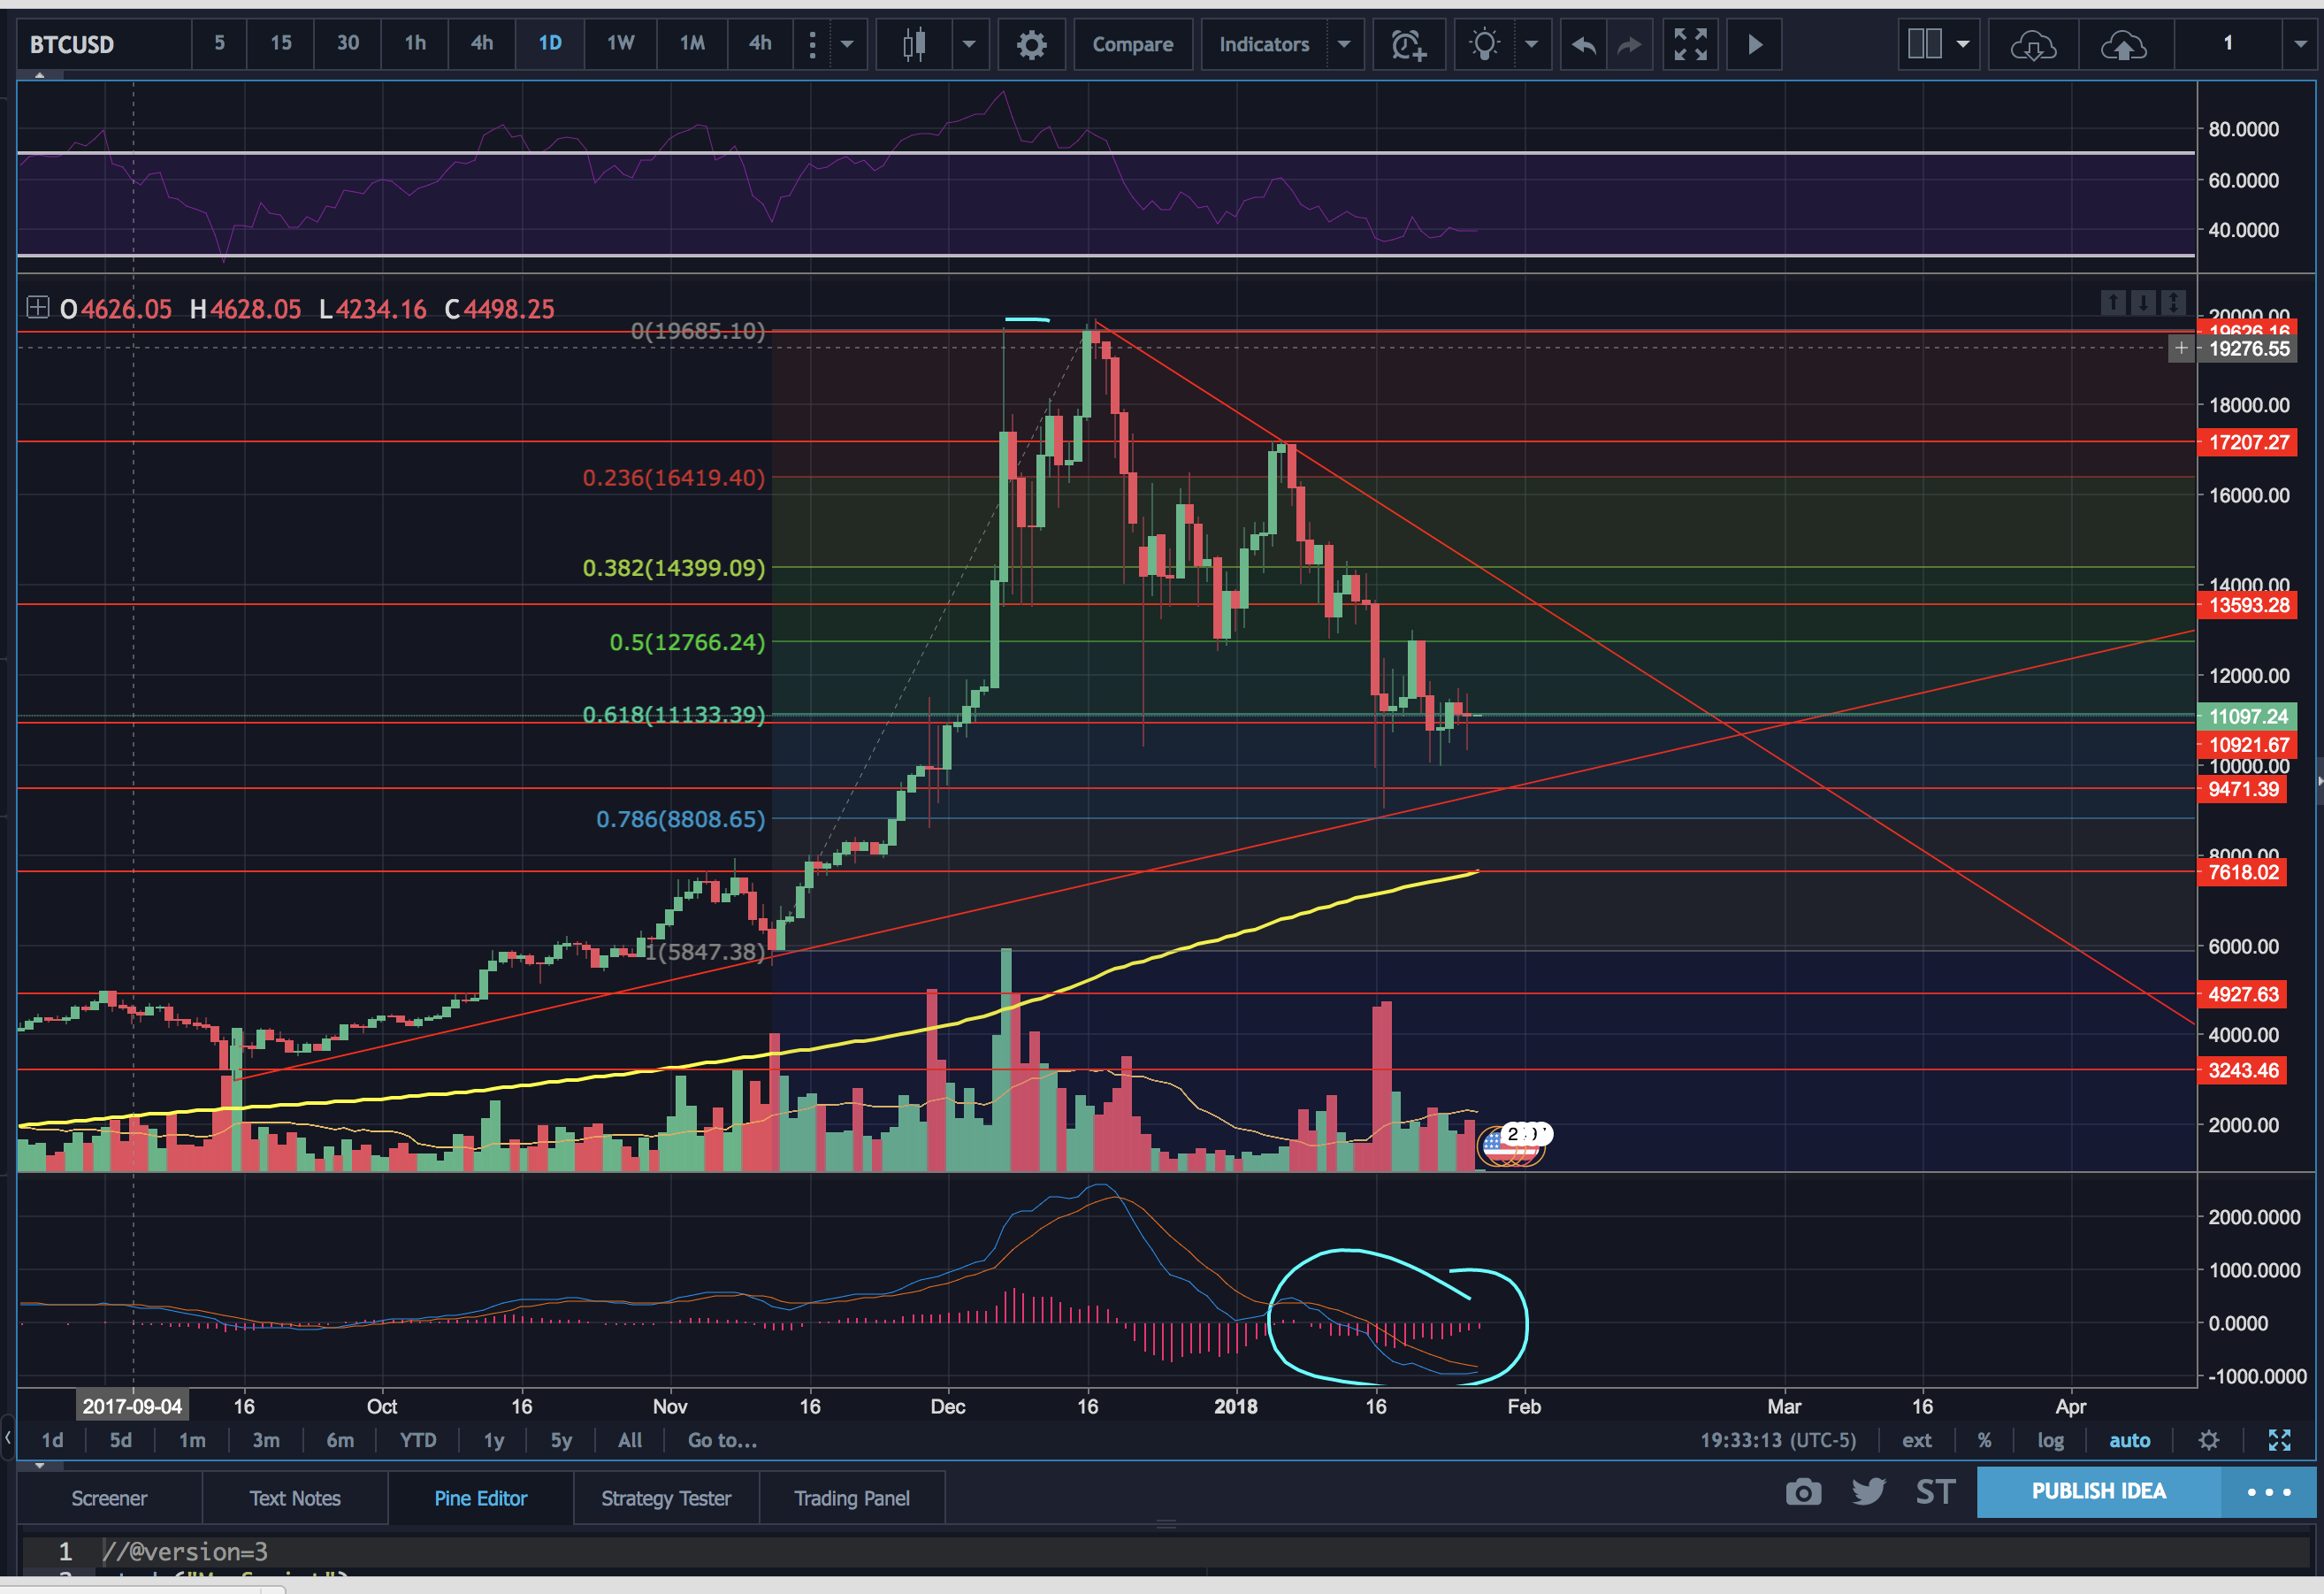
Presented first is the daily chart. Bitcoin CME futures contracts expired today. But bitcoin prices didn't really move. Currently the price movement is not reflecting on the MACD histogram which is circled in blue below. The Histogram is considered to be diverging from price, which means there is going to be a change in direction from the current direction. Also circled in the blue are the MACD and signal lines. Once they cross each other the direction of price usually also changes.
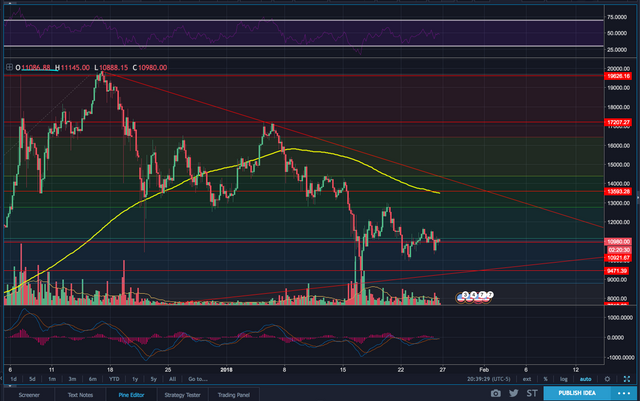
Given here is the 4hr chart. Bitcoin has been losing volume for the decrease in price. The two support areas are at $10,969~ and the next support area would be $9471~, once BTC touches 9,471 that is where the 4hr uptrend line is. And it should be going up from there. But there may be a quick dip downwards towards the 7.6-8k area. Maybe there would be a flash sale down due to weak hands or new investors.

Once we dial down to the 1hr chart, we take a look up top with the purple line, which is called the Relative Strength Index(RSI), which indicates momentum of price movement. This shows that the RSI is in the middle, which tells us that the momentum of price could go either way, although currently it is pointing downwards. We take into consideration the market sentiment and look for where price would go next. And considering that the yellow line in this picture, the moving average of the 200 previous candles, is just above the price action recently, it seems that there's been more bears than bulls, not allowing the price to push past the 200MA. Most likely the bear presence will push price further down to 10,000~ and once past there, to 9,471, and if there is enough sell volume during these times, the price will dip quickly down to the 7.6-8k area.
Disclaimer: This is my, Lee's Investment, own analysis of the CryptoCurrency chart(s). These are not to be taken as Certified Financial Advisor positions. Take these trades at your own risk. Lee's Investment, is not a certified advisory firm, and is only providing information for educational purposes. You are required to perform your own due diligence to take these trades. You should always check with your licensed financial advisor and tax advisor to determine the suitability of any investment.
Interesting analysis though I'm not normally into subjective TA but always curious what people think. Short term I'm bullish on BTC (and long term but it will have its ups and downs) as seen from my data below. Check this out if it interests you: https://steemit.com/steem/@weilii/introducing-the-neux-oracle-steem-and-bitcoin-trade-signals Just started following you, would appreciate a follow back if my price analysis content interests you as well :)