BTC & ETH Are Acting Like They Are Inversely Correlated??
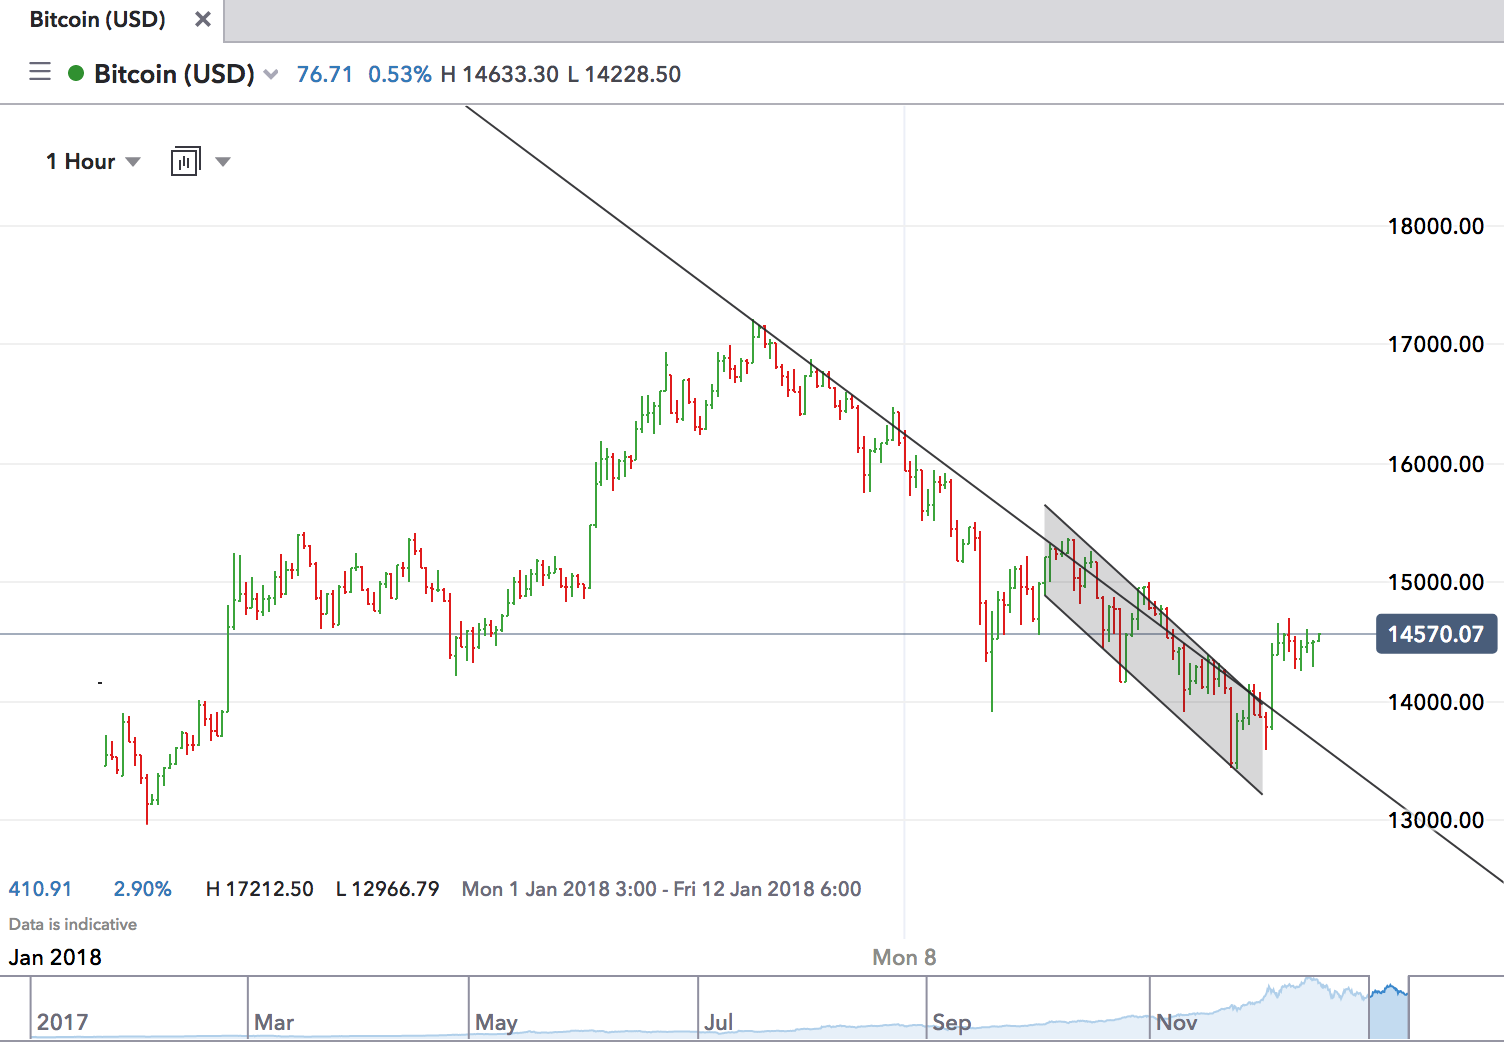
This is an update of the chart I posted earlier, showing the downward sloping channel, and a nice break out to the upside in the BTC.
And this is captured in the same minute...
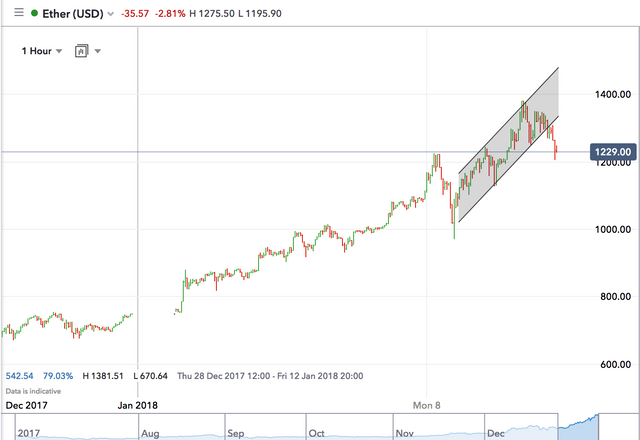
...where we see the UPward sloping channel in the ETH, and IT breaking out to the DOWNside at more or less the same time this afternoon.
I've only just starting looking at crypto charts seriously, but don't these babies generally move in lockstep with each other, rather than doing the exact opposite?
What's going on here?