BTC Bulls make first attempt at first of many resistance levels!
BTC Update!
Jumping off last chart from 3 days ago as things really just playing out as expected. We were pulling back 3 days ago and I was waiting to see if $6k area failed or held and then to see if we'd be able to battle $6400 area of resistance but anything in between was just a no trade zone. We've stayed within this zone for 3 days now and bulls are currently testing $6400 area. I am posting weekly, daily, and 4 hour charts today so bear (no pun intended) with me.
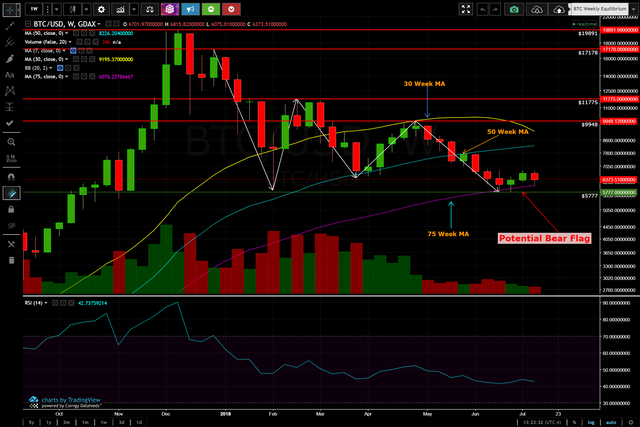
Weekly - we are riding 75 week MA currently as support but really I see more of a bear flag setup and eventually this caving further to the downside. Again, I still do not believe we have hit a bottom yet for this market. ETF approval COULD be a catalyst to change that otherwise continue to expect further downside personally.
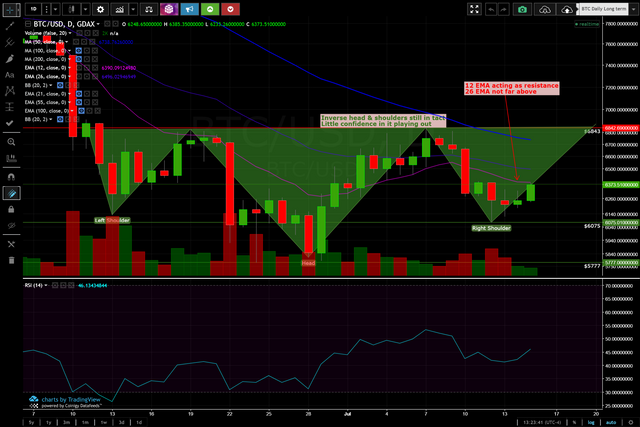
Daily - we needed the consolidation and bulls got a higher low thus far so $6,075 is our new higher low to maintain. We are still watching the inverse head & shoulders pattern. I just have little confidence in it for several reasons. 1. I don't really care for H&S patterns to begin with. 2. We are testing our $6400 area of resistance which also coincides with our 12 and then 26 EMA and are currently rejecting off 12 EMA. 3. We'd then have our 50 MA to battle which we have not been above since May. 4. We'd then have $6800 which we rejected from multiple times already. 5. $6800 would coincide with our neckline of H&S pattern and confirm the pattern to then give the actual break out from pattern. Problem with all of that is it's a ton of resistance spots for the bulls to bust through just to complete the right shoulder and with this low volume, bulls will be exhausted and bears can pile on shorts and wipe out days of gains extremely quickly. Bullish ETF news COULD also change this and keep momentum strong enough but personally wouldn't be betting on that.
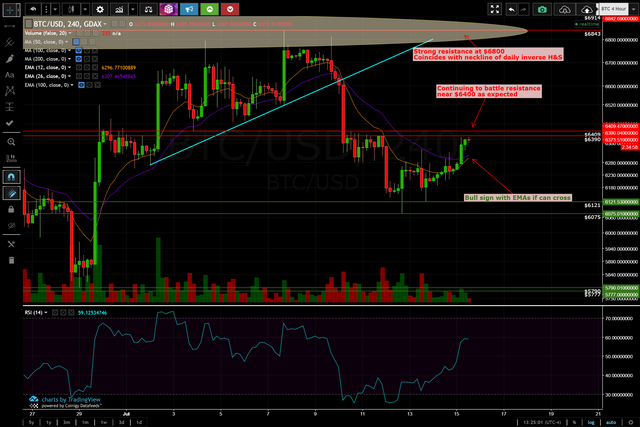
4 Hour - probably best of the 3 charts if you are playing bullish in my opinion. Bulls finally got above and stayed above both 12 and 26 EMAs. Close to getting a bullish EMA crossover and if bulls can convincingly get above $6400 resistance, we will see the crossover of the EMAs and bulls will push up towards $6800. Unfortunately that will also push RSI into overbought and likely slow the momentum going into the area bulls need it most ($6800).
So after all that, thanks for bearing with me.
Short term - neutral. Still within range of $6-6400. A break above $6400 and I may consider scaling into some positions if we consolidate some to try and test $6800 but currently have little confidence in the bulls.
Intermediate - bearish. Continue to wait for new lows to come in but will keep watch on ETF news as while it may not end a bear run, it will give heavy bullish momentum temporarily at minimum.
Long term - bullish. Still believe we have a lot of gains in the future but when that bull run starts, just have to patiently wait.
Just My 2 Sats!
.png)
.png)
.png)