Bitcoin market...
BTC/USD

In our previous analysis, we had forecast Bitcoin to reach the resistance line of the descending channel at $11,500, after breaking out of the 50-day SMA. Today, the cryptocurrency reached an intraday high of $11,147.99.
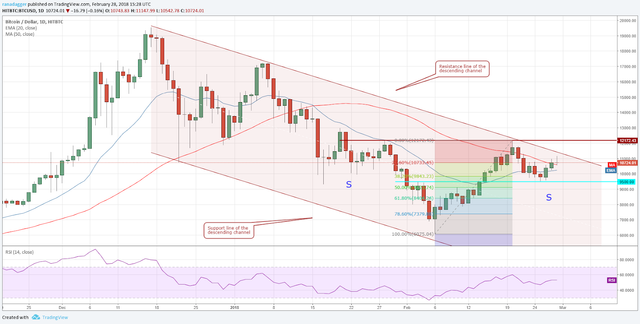
We believe that the zone between $11,400 and $12,200 will act as stiff resistance. Therefore, the aggressive traders should book profits on 50 percent of their positions at the current levels and hold the rest with a trailing stop loss.
A breakout of the $12,200 levels will complete an inverted head and shoulders pattern, which can propel the BTC/USD pair back towards the $18,000 levels.
The bears will gain strength once the digital currency breaks down of $9,400 levels. Until then, it is bulls advantage.