Ethereum (ETH) Update-Bears Roar!! Further Correction Incoming (charts)
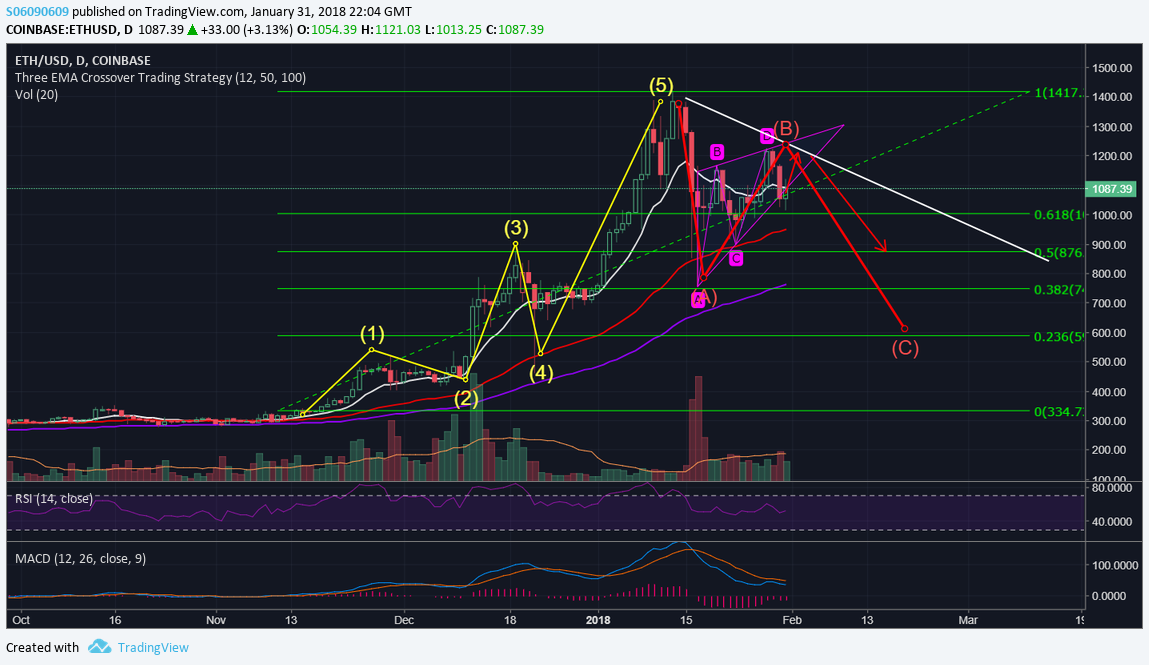
ETH had a pretty strong run up recently, which exhausted 5 Impulse waves. On daily chart, the price hit a reversal and created A and B waves of ABC correction. As you can see from the chart the price is fluctuating in a rising wedge of wave B of the correction which indicates that at some point in very near future wave C will take place and further downfall will happen (very likely to be accompanied by BTC run to 7-8k at the same time.)
Furthermore, on the 4 hour Chart you can see that EMA's remain very close together, and 12 EMA seems to be crossing both lines very soonish. In my experience, when all 3 lines remain extremely close to each other and are crossed in a short period of time this creates a strong impulse, in this case this impulse (if happens) going to be bearish.
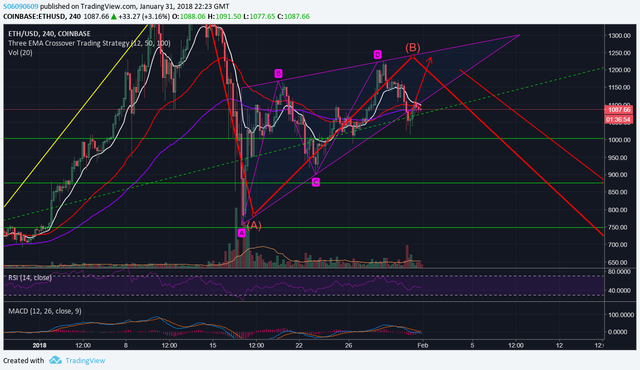
Short term, while EMA lines remain close together, this also provides strong support level, and the price may bounce up 1 more time to the top of a rising wedge before its final fall.
Always use Stop Losses!