Bitcoin Awaiting Bullish Volume From Dips
The crypto market drifts lower today, after a completed bullish inverse head and shoulder reversal yesterday, but a lack of volume to confirm. Are the bears satiated yet or will the bulls take advantage of their opportunity?
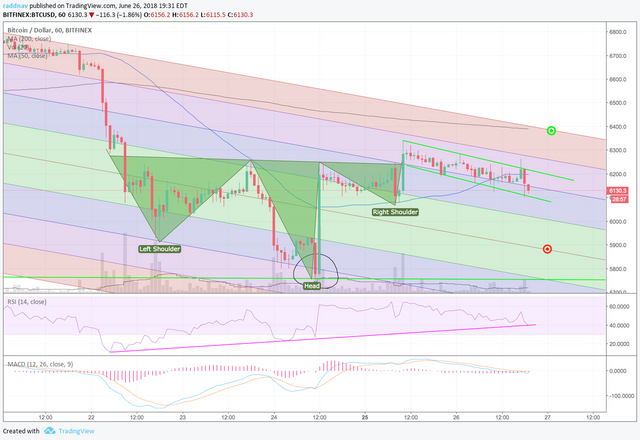
On hourly analog Bitcoin Bitfinex chart, there really hasn’t been much of a move since yesterday and price has just been gliding slowly down along the purple channel in the long-term down-trending pitchfork.
There have been several wicks pushing price down into the blue 1 standard deviation channel of the pitchfork, but the bulls remain hopeful for a push upward.
Earlier today around 9am EST, price broke down through the 50 hour moving average and the bulls have not been able to get price back above there where it now resides at $6,200.
The candle from 5pm an hour ago did break to the upside, however it appears to be a fake-out where the bears are desperately attempting to push price lower. As of now they have only been successful pushing price to the bottom of the purple channel.
I have drawn a bullish flag formation between the lime green lines, which could indicate a pop higher, but even that looks quite weak. You might have to be crazy trying to trade this, because despite the bullish formations, volume is weakening again and the only thing that seem to generate any buying momentum are new lows.
The RSI is fairly neutral at 43.39 and is heading back to oversold levels, making a pop in price reasonable from these levels. I have also drawn a pink up trending line on the RSI that could be decent support around 40.
The MACD is also down into below 0 territory again and the break of that level didn’t do a whole lot for the bears either. The trigger line acts like it wants to pull bullishly upwards, but just as easily continue lower.
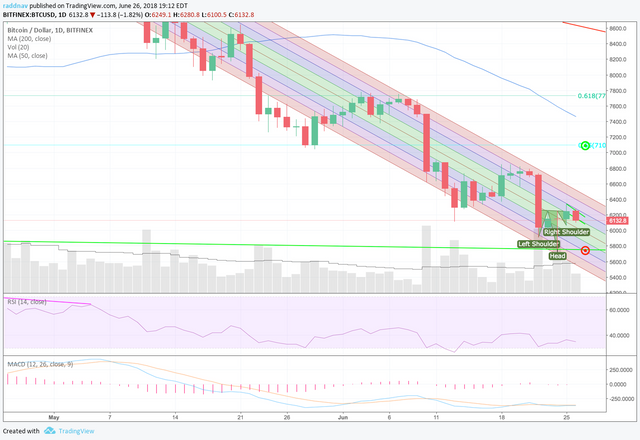
A quick look at the daily analog Bitcoin Bitfinex chart, because not a whole lot has changed since yesterday. With the hourly chart appearing to want to break lower, a decent buy target could be around that median line on the down-trending pitchfork at about $5,750.
There is also convergence with that price level on the long-term lime green down-trending support line. RSI and MACD are bot are in a good position to pop higher, but as usual there needs to be an increase in volume which we aren’t seeing.
The $250M in Tether that were created yesterday and Charlie Lee warned about on Twitter could be an indication that buyers are coming. If price does continue to break to the downside I would not be surprised to see a huge jump in price out of nowhere. That is where the biggest buy moves are happening in this down-trending market and it’s usually off of some panic selling.
This slow price roll over pattern is beginning to get a bit redundant for the bears and shorts and I have to wander if someone is going to rip there faces off to the upside if it happens again. Time will tell.
I have a raging headache today, so I will leave it there for now.
-More on Vanddar.com