Trading Triangles, how to understand and use them in the Cryptocurrency Market

Written by Dhiresh Dabasia
This article will discuss the use of triangles. Those are a type of chart patterns, and act as extra confluences when looking to take trades. It is crucial to use chart patterns together with candlestick patterns to have the best risk/reward trades.
Symmetrical Triangles:
The Symmetrical Triangle pattern is one which has convergence at an apex after forming lower highs and higher lows. The signal this occurrence sends through the market is that the buyers are failing to push the price higher and the sellers are failing to create further downward pressure. This Pattern should not be traded as the fluctuations within the triangle are too small. Instead, wait for a breakout, as they tend to give a higher probability trade, along with a better risk/reward ratio, compared to the movement within the triangle. Below is a diagram of a Symmetrical Triangle.
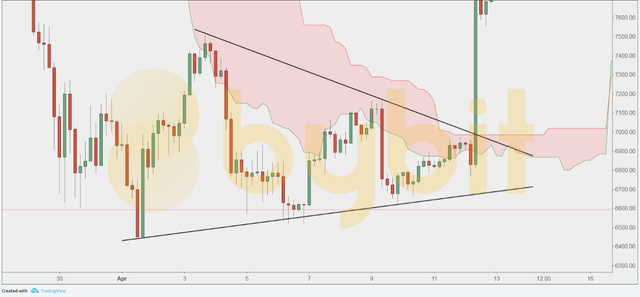
As can be seen, the price is contained within a descending trendline and an ascending trendline (creating a Symmetrical Triangle). In this case a break to the upside occurred; however it is critical to remember that the break could occur both directions. A nice area to enter a trade would be on the break and retest of either trendline with a stop loss at previous highs or lows (depending on the direction of the breakout).
Ascending Triangles:
The Ascending Triangle pattern is one which consists of an ascending trendline, and a key resistance level stopping price from breaking to the upside. So, in this case there are higher lows and flat (horizontal) highs at the resistance, meaning buyers have a slight edge in pushing the price higher. A diagram of an ascending triangle pattern is shown below.
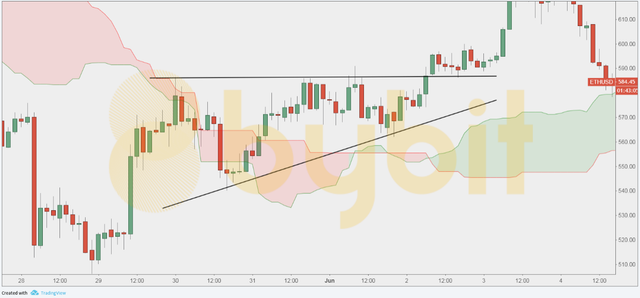
As can be seen, the price breaks to the upside. In the case of an Ascending Triangle, there is a higher chance of a break to the upside rather than to the downside, as buyers create higher lows. However, there is still a chance of a break to the downside, so it is essential to be ready for a move in both directions. Again, an entry can be found at the break and retest of either the ascending trendline or the resistance level.
Descending Triangles:
The Descending Triangle pattern consists of a descending trendline and a significant support level. In this case, there are lower highs and a support line which price cannot seem to break through, meaning sellers have a slight edge in pushing the price lower. A diagram of a Descending Triangle is shown below.
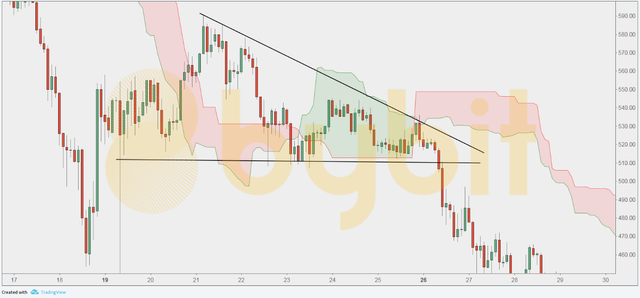
As can be seen here, the price breaks to the downside. In the case of a Descending Triangle, there is a higher chance of a break of the support level. However again it is critical to know that a break could occur in both directions. One would enter when a break and retest occurs on either side.
I hope you enjoyed reading this article and tune in for more in the future as more chart patterns will be explained, as well as psychological refinement, and how to deal with emotions when trading.

Where to Find Us:
Website: www.bybit.com
Twitter: www.twitter.com/Bybit_Official
Reddit: www.reddit.com/r/Bybit/
Medium: www.medium.com/bybit
Bybit informs readers that the views, thoughts, and opinions expressed in the content belong solely to the author, and not necessarily to Bybit. Bybit does not guarantee the accuracy or possible uses of the content posted. Under no circumstances whatsoever shall Bybit be deemed responsible or liable for any decision made or damage incurred due to the content and information posted on this social media.