One Year of BCN Technical Analysis Reviews
Bytecoin Price Charts by Coinigy - as traded on Poloniex. Starting with the oldest charts first and moving forward in time as you scroll down.
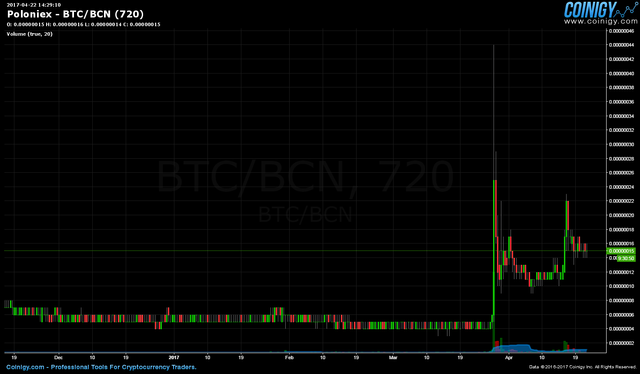
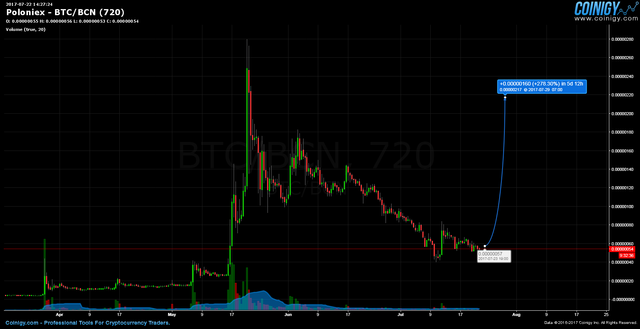
March 22 2017
The initial breakout of BCN in late march 2017 showed two strong waves of pre-pump activity. We can see in this chart these early stages took almost one month to complete.
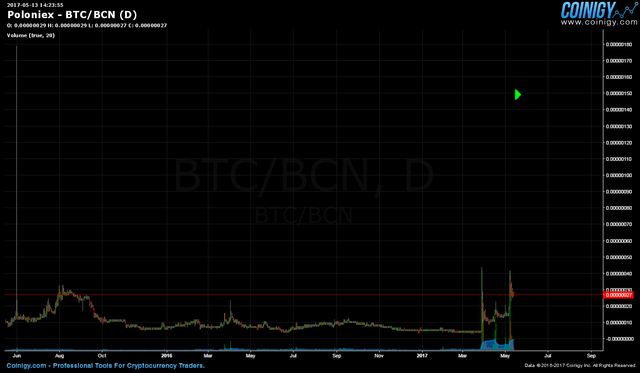
May 13 2017
Bytecoin shows the start of a third strong wave of buying - some six weeks after the first spike in prices.
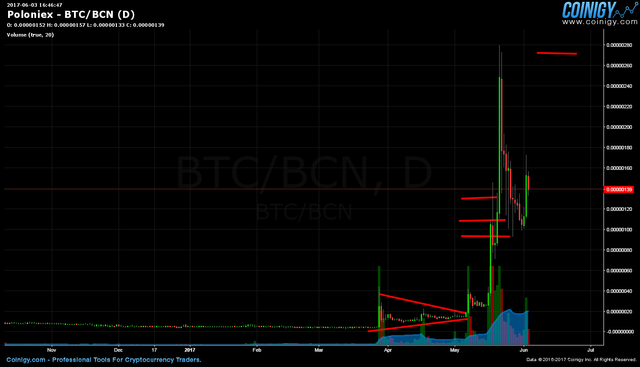
June 3 2017
Here in early June, we can see now that the MAY 2017 spike in prices turned out to be a strong wave of crowd buying. The red marks on the chart show my sell points.
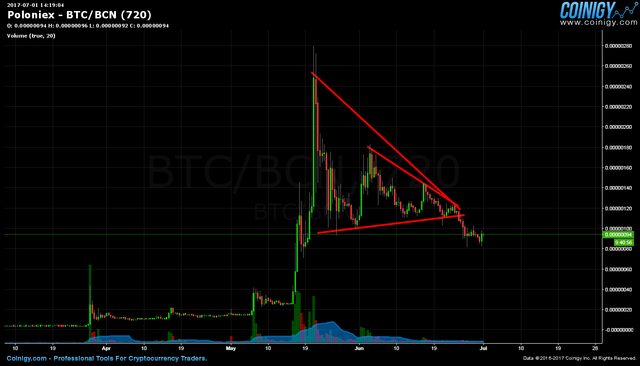
July 1 2017
After the mass surge in may 2017, the rest of the crypto markets were topping out and the bull run from March 2017 to the end of June 2017 had ended.
July 22 2017
Never stopped seeing the return of the bull, in late July 2017 I predicted another mega wave... that never did materialize.
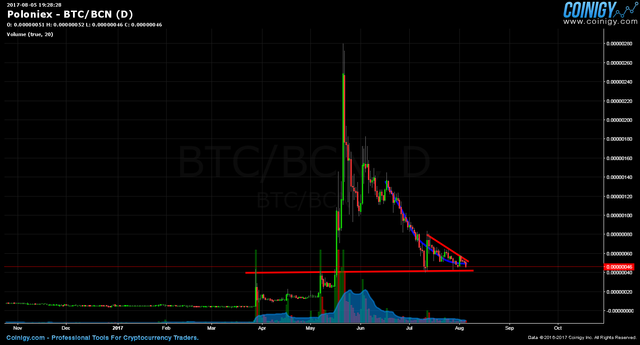
August 5 2017
August 2017 bytecoin prices showed a potential bottom formation with a descending wedge hitting old historical prices
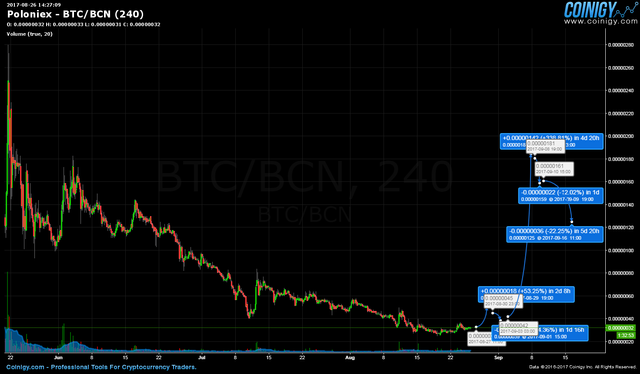
August 26 2017
In late august, still anticipating a bull market to be around the corner - made predictions of another wave up - that did not come.
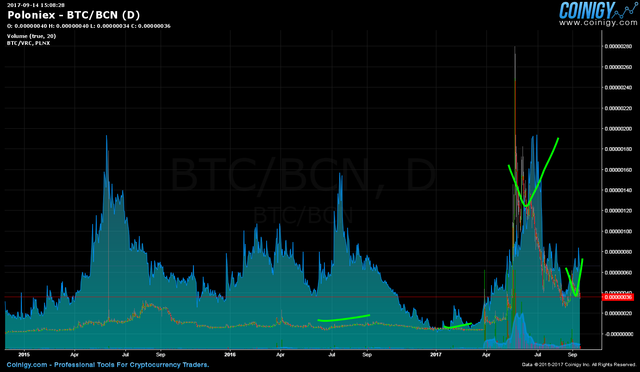
September 14 2017
September 2017 - a process of finding markets that matched four criteria - seeking to anticipate the bull market to come. We can see the price of bitcoin against BCN, and as we know now, bitcoin went on a strong move higher and all the altcoins prices dropped. The early part of this divergence was already showing in the comparison charts
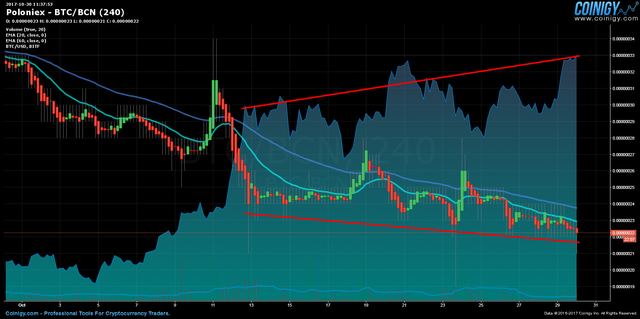
October 30 2017
October 2017 - observing the divergence of bitcoin rising and alts dropping - seeking to find when the alts 'turned' and start to match bitcoin's price surge as they had in april/may/june of 2017 - but no such change happened in the months following
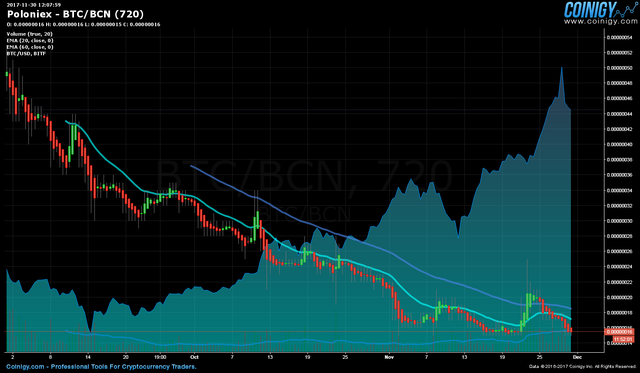
November 30 2017
November 2017 a potential bottom with a potential top in Bitcoin. The momentum change appears to be starting, but the final wave of Bitcoin mania, and altcoin capitulation was still to come in the following weeks
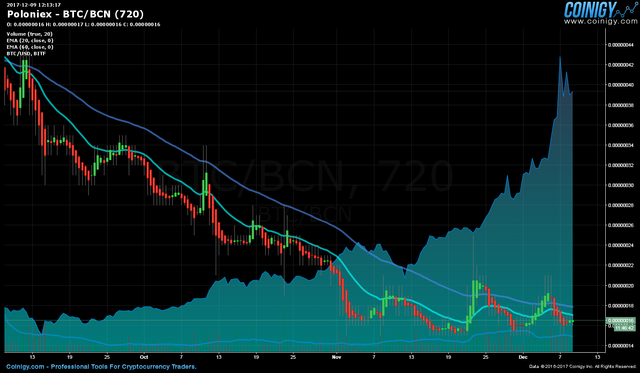
December 9 2017
December 9 2017 - a fantastic looking potential bottom in place for bytecoin and many alts - and BTC in an inviting potential top formation. The 3 month EMA had not yet crossed over in either market, but may perma bull's could not help but take positions.
February 2 2018
After the December 17 to January 18 surge, this chart shows a long term prediction of price moves for BCN .
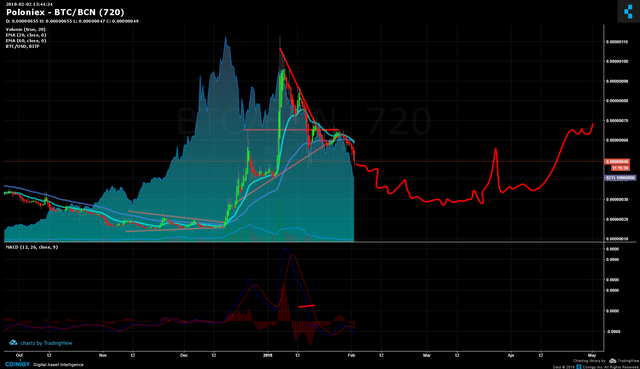
March 20 2018
Late March 2018 - shows the February price prediction was very nearly correct, as of this date. BCN prices have not yet broken the short term down trendline, they have not broken higher from a 1-2-3 bottom, and the 3 month EMA have not crossed over. This market does not yet match our sample trading plan criteria.

Conclusion
I did not give this market the credit I should have, for the potential it had. Back in March of 2017, I had no predictions for this coin, yet it made an astonishing move.
The start of this huge move is worthy of close study, for we are now, in late march 2018 - standing with chart patterns that provide the potential for such moves again.
The key points I've taken after reviewing the year of chart predictions for all the markets on poloniex - is that I was over trading way too much - and that the 3 month EMA crossovers are much more important than I weighted them.
The sample trading system, on March 22 2018, is in standby mode, and not taking a position in this market yet - EVEN though this could be the bottom... the sample trading system does not want to hold a flat market, and wants to avoid fakeout breakouts. This chart pattern must show a trend change and strength enough to have moved the 3 month EMA back into a bullish crossover.
---
Also find
Nice post