🎓 The above chart (prices as per Coinbase) shows
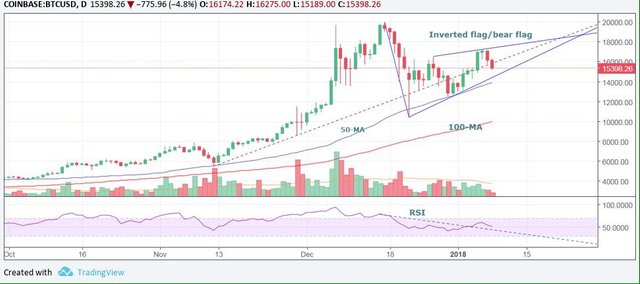
👉 Bear flag – a bearish continuation pattern. A downside break – i.e. a close below $14,460 (flag support) – would indicate the corrective rally from the low of $10,400 (Dec. 22 low) has ended and the sell-off from the record high of $19,891 has resumed.
👉 The relative strength index (RSI) is back below 50.00 (bearish territory).
thanks😁
👉 Since Dec. 21, trading volumes have remained well below the 30-day moving average. A sharp rise in volume on negative price action today (today) would boost odds of a bearish breakdown in prices.
Check out my lambo that I got from investing in ripple 🚀🚀🚀🚀 :
https://steemit.com/ripple/@karolynaz/thank-you-ripple-for-my-first-lamborghini-omg-please-share-if-you-like-ripple
This post has received a 1.61 % upvote from @upmyvote thanks to: @rihaan. Send at least 1 SBD to @upmyvote with a post link in the memo field to promote a post! Sorry, we can't upvote comments.
Thank you @rihaan for promoting this post together with https://steemit.com/budget/@jerrybanfield/introducing-steem-budget-proposals