Haejin's Sandbox 17.12.2017
Hello everyone,
I would like to introduce Haejin’s Sandbox. This is a new blog series that I will be attempting to post frequently (hopefully at least a few times a week, but the three kids will probably have something to say about that!!!).
I discovered @Haejin back in June, and was one of his first couple of hundred followers. Like many others, I have been impressed not only with his great technical skill and accuracy, but his fantastic attitude and wish to give to the crypto community. I was also lucky enough to have many of my requests taken and direct questions answered in the early days. I have found over time that my questions are answered less frequently, but this is completely understandable given the growth of his following and the flood of requests he receives.
However, I also feel like I am now past the point of simply requesting a new analysis. I have begun to practice with the tools Haejin has introduced me to, and my questions are now much more specific in relation to a particular chart, or I simply want to have some feedback on a count. I think there are many others out there like me, and I believe those numbers will only grow.
I believe it is time for the community of Haejin’s followers to have a venue to practice their charting, to ask questions of others more experienced than them, and to receive feedback on their ideas. Maybe once in awhile the Master himself will check in on the community. We are all living in Haejin’s world, so it’s time we start to play in Haejin’s Sandbox.
The purpose of the blog is for followers of Haejin (or anyone else of course) to post their charts in the comments section, and ask any questions related to those charts.
I hope that the community’s collective knowledge will serve to help everyone become better at this craft.
The blog is NOT intended to serve as a collection of requests to Haejin.
Remember, this is definitely NOT investment advice, this is simply a place where I hope we can all learn a little more about Technical Analysis.
Here are some useful links:
Official Home of Haejin’s Archives
Markdown Cheatsheet, which is really helpful for posting.
Based on the excitement of yesterday, I thought I would kick things off with my thoughts on Verge. I was out for most of the day, so I think I missed my chance to take some profits. However, I think that chance has now passed, and there is more up- than down-side ahead. Please comment, provide feedback, post your own charts on your coins of interest!
Biggish picture, $ Chart
3 Minute Close up on the $ Chart
Confirmation on the BTC Chart?
@cannonball6 - thanks for setting this area up - look forward to interacting with the community on the exciting ride ahead
Glad to see someone is doing this.... I guess I should have but like everyone else, too busy.
 ![]
![]
Here is what I see. But very new at this so.....
How did I do? BTS 30 min chart Poloniex. 7:21 PST 18/12/17
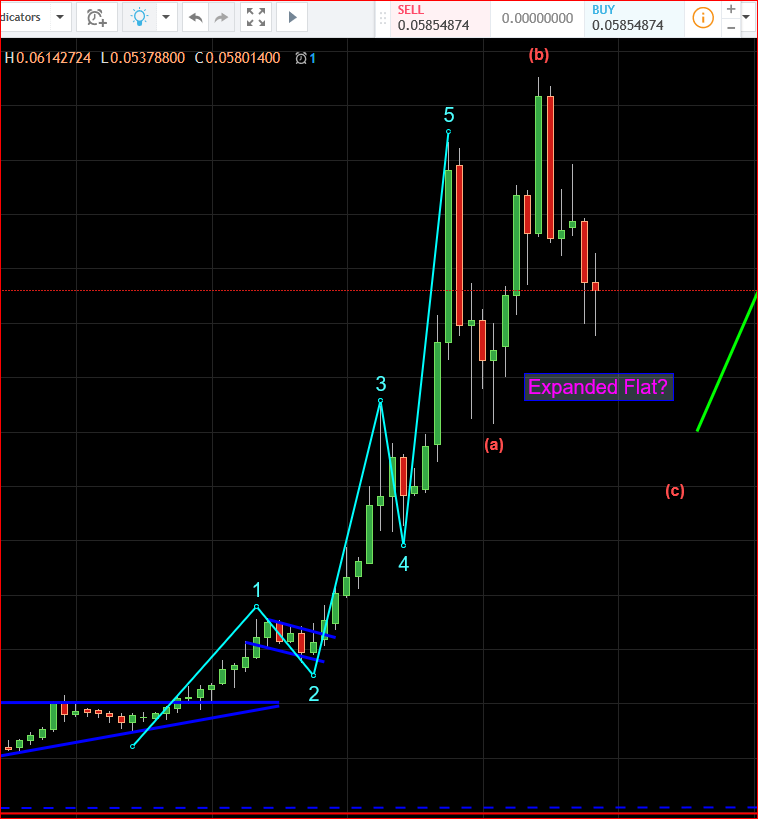
Well you are recognizing the triangle corrections on the zoomed in chart. I think it is also good to zoom out a little for a different perspective. And try linking things with the 1-5 impulses. I haven't spent a lot of time on the BTS chart today, but I actually think it might channel horizontally a bit. If you zoom out, you could have A-B-C-D of an A-E channel in, with potentially one more drop close to $0.35...my thoughts anyway.
Ok thanks for the feedback! I'll keep practicing. looks like it broke out of the triangle at D, so E didn't get hit. I can post a zoomed out view and show where my 1-5 impulses are maybe tomorrow. the top of my blue line would be my wave 1 target, close to Haejin's .52 cent call.. but he did say could be much higher.. and in an earlier post was calling $1-19 if things go crazy vertical... so I'm holding, even though I would be tempted to sell at .52 and ladder back in at the W2 target to accumulate more BTS.
here's my zoomed out impulse 1-5 view. used fib extension .318 to get W3 target. and 1 to get W5 target.
here's a zoomed in view with a horizontal channel. i'm having a hard time finding your ABCD correction when you zoom out. i calculated my W1 target by using the distance from the top and bottom of the channel. how does one know when that channel breaks to the upside or downside? thank you!
Way to go on setting this up! It will be interesting to see what works to keep it organized. Something like:
Then, people can scroll down until they find the analysis they are looking for or want to contribute too without much trouble.
Great idea! I've been following Haejin for the last 2 weeks now and am amazed by his skill and love the way he explains his charts. I'm not yet in a position to contribute, as I'm learning, but I'll definitely be following this and hopefully contribute in time!
Thanks, hopefully this becomes a place where people learn they can go to to ask TA questions and receive feedback. Right now, someone might post a chart in one of @Haejin's blogs, but he is so prolific that many of his followers move on to the next one and miss the chart.
Hi, thank you for creating Haejin's Sandbox. I'm a follower and recently he suggested BTS might be a good hold. So, i purchased some BTS but I'm confused. Here's a link to a screen shot. I think i need to move open.bts to bts but not sure how. This is a newbe Q and I apologize if this is not the correct forum. Thank you,
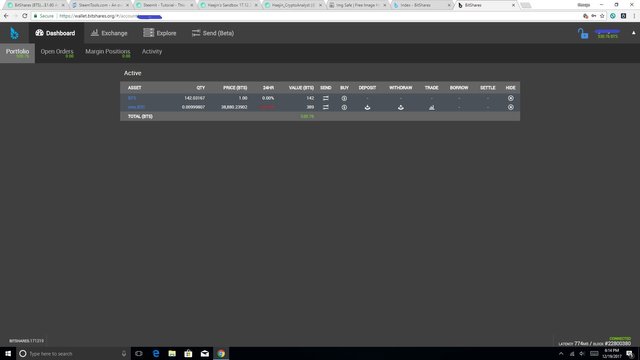
It looks good to me. It shows that you have 142 BTS and also some open.BTC which is BTC that is backed by Open Ledger which I assume is the gateway that you used to transfer funds to the BTS DEX.