Where to next for Etherium?

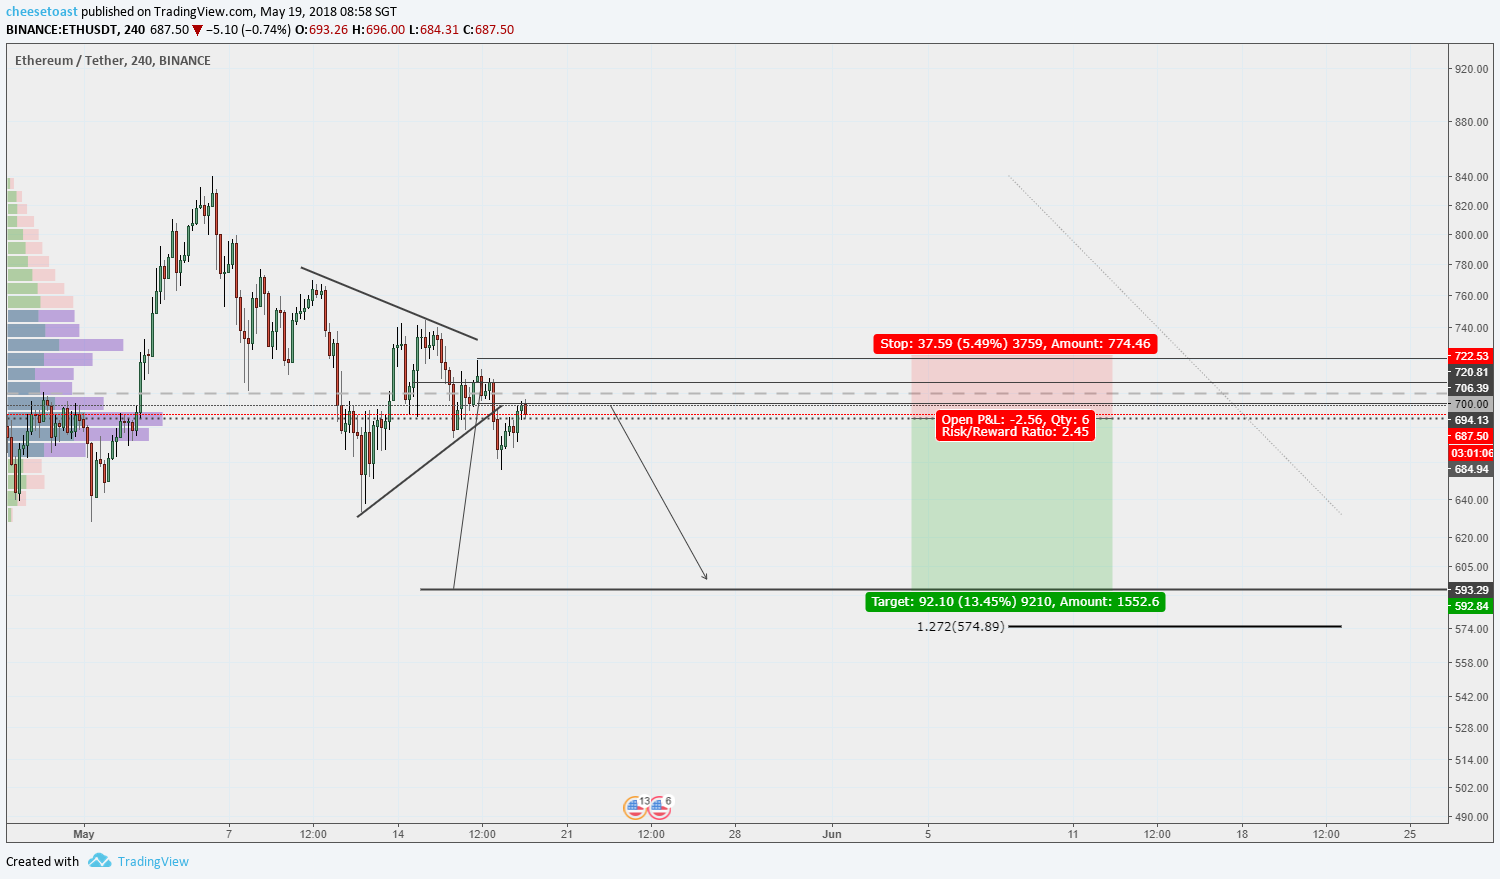
For those that follow me on TradingView, after a couple of bull traps we have reached our profit taking area on ETHUSD as expected. With stops at break-even, this is now a risk free trade at 13% ROI so far.
The short sell setup was posted on the 19th May:
(Right-click and open image in new tab for full-size)

Where to next?
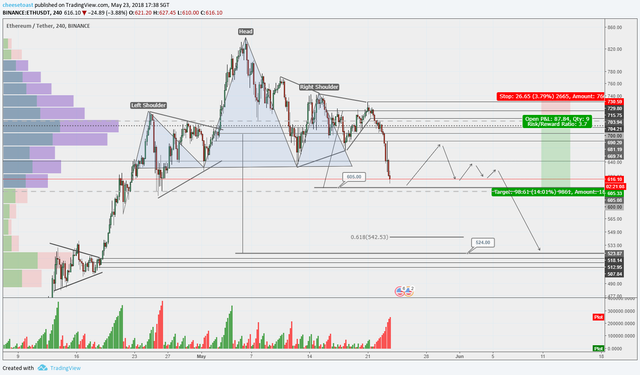
From here, I would anticipate profit taking to take place now and see a small retracement.
A possible reversal point would be a re-test of the previous consolidation zone around the $690 to $705 area, which is also the neckline of the head and shoulders pattern. Yes, this is not a traditional neckline for a head and shoulders pattern, but that's a explanation for another day.
With a projected profit target still on the table, entering into a sell trade from this consolidation zone would offer a very attractive risk to reward (4:1) for a gain of 21% ROI if price can reach $524.
(Right-click and open image in new tab for full-size)

Follow LIVE at TradingView: https://goo.gl/C31sHA
This area is also the projected target of the head and shoulders pattern. There is also confluence at this area which resides just above a previous consolidation zone (origin of a breakout pattern where demand exceeded supply) and the 61.8% retracement of the move from the April lows ($355) to beginning of May highs ($840).
As the overall crypto market is in a down trend, we must assume selling pressure is to remain. A solid break of the consolidation zone between $715 and $730 would result in a re-evaluation of the bearish assessment.
Disclaimer: This is only my opinion, make of it what you wish. It is not financial advice.
