BTC/USD Parabolic Run and Potential Resistance
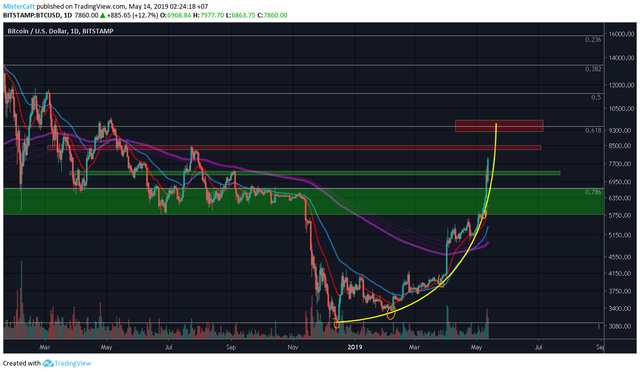
So far it's very bullish after btc/usd just breach 6700 area.. while it's price action rapidly going up it creating some kind of parabolic run up, sudden increased demand for btc and it still continue for now. which is creating a higher stake unto a potential bull trap or harsher retracement if the price action showing it's weakness. It's interesting when btc price action move crossing parabolic curve line ..
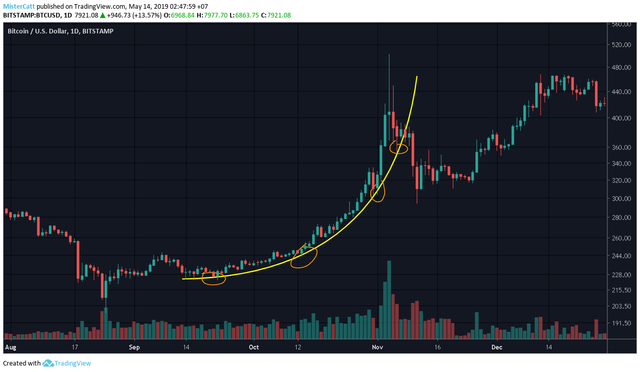
2015
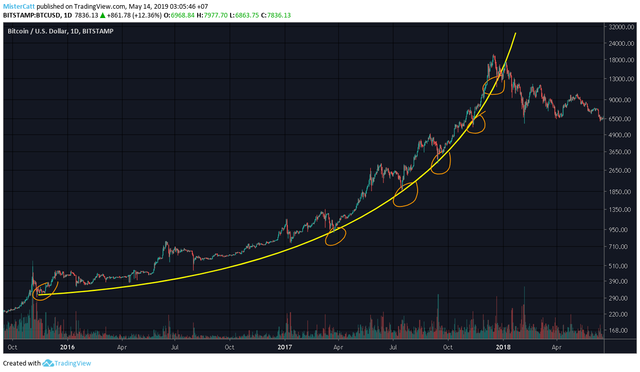
2016-2017
2018
Resistance #1 : 8400 based on past consolidation and past top price action
Resistance #2 : 9500 based on fibonnaci retracement past consolidation and past top price action
Support #1 : 7300 based on past consolidation and past top price action
Support #2 : 6700 based on fibonnaci retracement past consolidation and past top price action
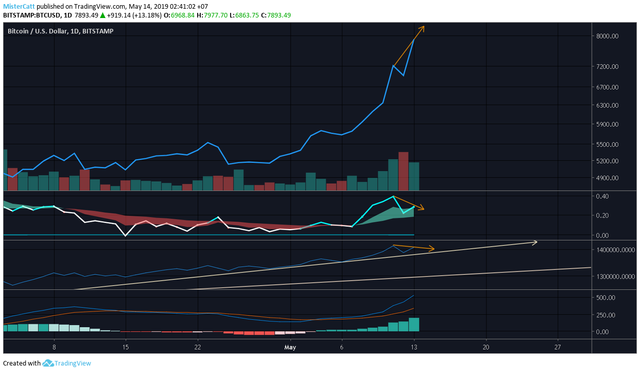
Indicator
MACD, OBV and CMF still continue it's Bullish trend while there's a slight bearish divergence between some indicators and price action for now.
please take this idea as a grain of salt as reality always differ from what i expect as this post merely just an opinion.
and please feel free to share what your thought on comment section.
peace.