XRP weekly chart Bullish
Disclaimer :- keep in mind that I am not financial adviser and not forcing you to buy or sell anything profit is yours as well loss is yours. Its only for Educational purpose.
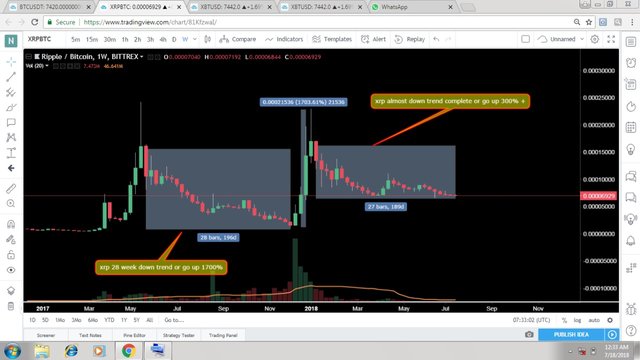
Its weekly chart 1 candle is equal to 1 week.
In may - june 2017 xrp was at peak point after getting pumped its downtrend time the downtrend time was about 28 weeks after sleeping 28 weeks it pumped to 1700% in december 2018
Now history repeated xrp again start to go down from jan 2018 its downtrend time was about 27 weeks and now time for pump of 300%
==================================


thanks
@rehan12092786
Congratulations @rehan12092786! You have completed the following achievement on Steemit and have been rewarded with new badge(s) :
Click on the badge to view your Board of Honor.
If you no longer want to receive notifications, reply to this comment with the word
STOPTo support your work, I also upvoted your post!
Do not miss the last post from @steemitboard:
SteemitBoard World Cup Contest - The results, the winners and the prizes
I hope xrp will sky rocket