Are all cryptocurrency moving with market
In the last few days, i experienced a massive rout in the cryptocurrency market. The home page of coinmarketcap is awash in a sea of red. And as if by some strange design, every 7 day price graph looks like they’ve been lazily copy pasted from coin to coin like this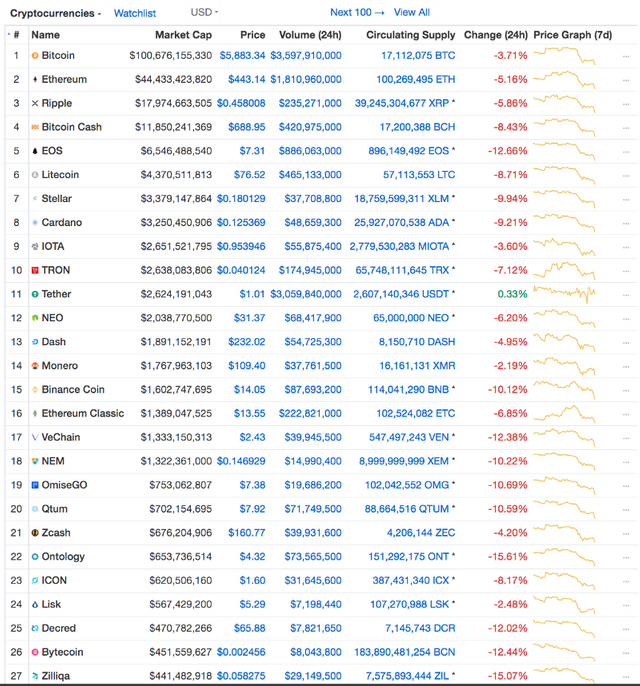
In times like these we have to wonder:
Are all cryptocurrencies correlated with the market?
Are there any coins that are resistant to large market movements?
This topic has long plagued my curiosity. So, I’m going to analyze the historical data and attempt to answer the following questions:
A. How many coins are strongly correlated with the overall market?
B. How many coins are strongly correlated with Bitcoin?
C. What are the coins that are the least correlated to the overall market?
D. What are the coins that are the least correlated to Bitcoin?
E. How do the top 20 coins by market cap correlate with each other?
Looking at the Data
We’re going to analyze 2 years of historical data from Coinmarketcap (CMC) from June 22, 2016 to June 20, 2018.
There can be quite a large spread in price between exchanges. This is why we’re going to use CMC. CMC derives price by taking the volume weighted average of all prices across every exchange.
Criteria & Focus
We’re only going to look at coins on CMC that have at least 120 days of historical data.
We’re only going to focus on the top 200 coins by market capitalization. I want to focus on medium to large cap coins because they have more trading volume and liquidity.
Let’s Begin
The first thing we’re going to do is to fetch the data. CMC has an API for current data, but none for historical data.
We would have to scrape this data ourselves from CMC’s historical snapshots, but fortunately awesome people have already build scrapers to do that.
We can use coinmarketcappy to get historical data on the total market cap and we can use cryptomarketcap-historical-prices to get historical data for individual coins.
- How many coins are strongly correlated with the market?
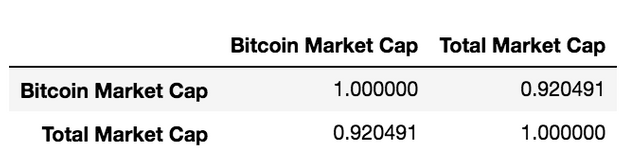
Before we dive into the results, let’s run through an example of how to calculate correlation between BTC and the market.
We don’t want to double count BTC’s market capitalization, so we will subtract BTC’s market cap from the total market cap.
Rest of the Market Cap = Total Market Cap — Individual Market cap
Once we have data for BTC’s market cap and the overall market, we can calculate the Pearson correlation coefficient between the two over the entire time period.
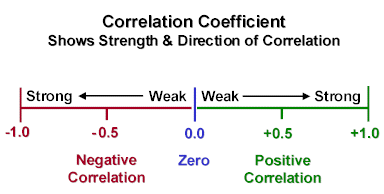
A correlation coefficient of +1 implies that the pair will always move in the same direction. Conversely, a correlation coefficient of -1 implies that the pair will always move in the opposite direction. If the correlation coefficient is 0, this suggests there is no observable linear relationship between the two.
Here’s the correlation matrix between BTC & the overall market.
All we have to do is repeat this process for each of the top 200 coins. Then we can plot a histogram and density plot with all of the correlation coefficients.
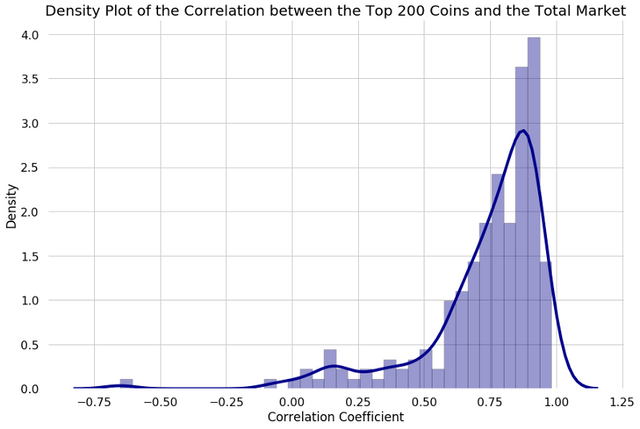
From a glance, our density plot indicates that most coins in the top 200 are highly correlated with the market.
75% of the top 200 coins have a correlation of 0.67 or higher.
50% of the top 200 coins have a correlation of 0.80 or higher.
These numbers suggest that when the market goes up, most coins are also likely to go up. And when the market goes down, they are bound to follow.
How are the coins in the top 20 by market cap correlated to each other?

To me, it means that we are still in an early industry, where the movements between cryptocurrencies have not settled. So while looking at this data is interesting and can tell us about the past, take it with a grain of salt when moving towards the future.
✅ @urvaprofit, I gave you an upvote on your post! Please give me a follow and I will give you a follow in return and possible future votes!
Thank you in advance!
ok i will keep in mind to do the thing
upvote for me please? https://steemit.com/news/@bible.com/6h36cq