ETH/USD - Has Ethereum Finally Broken Out From It's Down Trend?
Ethereum Market Analysis
Year on year cryptocurrencies have been making new All-Time Highs and last year they went on to make every headline, drawing in a lot of first-time investors which further pumped the market up to ridiculous highs around Christmas 2017.
We saw a lot of 'dumb money' entering the marketplace in the second half of 2017 and when everyone expected a pullback (correction) the prices just kept soaring up higher but what goes up, must come down and so, a market correction was long overdue. It wasn't a case of 'If' but more 'when' will the market correct. - Smart investors held back waiting for a discount but with so much hype, the FOMO was real.
After a blinding good run and a Happy New Year the crypto market tipped over from its All-Time Highs and started to come tumbling down and at full pace. The entire cryptocurrency market has since been locked in a market-wide correction and has fallen so hard it's made grown men cry.
A lot of people have been selling off their assets for a fraction of what they bought-in at and those with fancy mining rig farms have been selling off as well - I set up some notifications on a few popular marketplaces for when common gaming graphics cards come back on the market... such as the GTX 1060, GTX 1080 and RX 580 (typically used for cryptocurrency mining) and almost each day I'm seeing notifications that 10-15 new listings have come online for Used Graphics Cards matching my requirements.
We've had an entire week of sunshine in the markets and everyone is smiling, the buzz is back but for how long? Are we out of the bearish downtrend for good? - It might be too early to speculate but I have decided to do a quick top-down market analysis for Ethereum... take a look and let me know what you think.
ETH/USD Weekly Timeframe
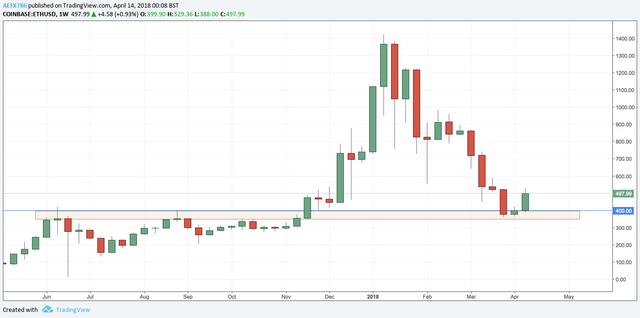
We can clearly see the market made 4 attempts from June '17 through to December '17 to break and close above $400. The market then consolidated its gains for two weeks before continuing to rally higher. As the market then came tumbling down, making lower highs and lower lows, notice how it reacted at the $400 level...
Last week the market formed a spinning top candle right on the $400 Even Number Psychological Support Level... a textbook reversal setup, followed by this week's bullish momentum. According to this weekly chart, we are still in the downtrend as price failed to close making a higher high but we have got the weekend yet and so far it is looking good.
ETH/USD Daily Timeframe
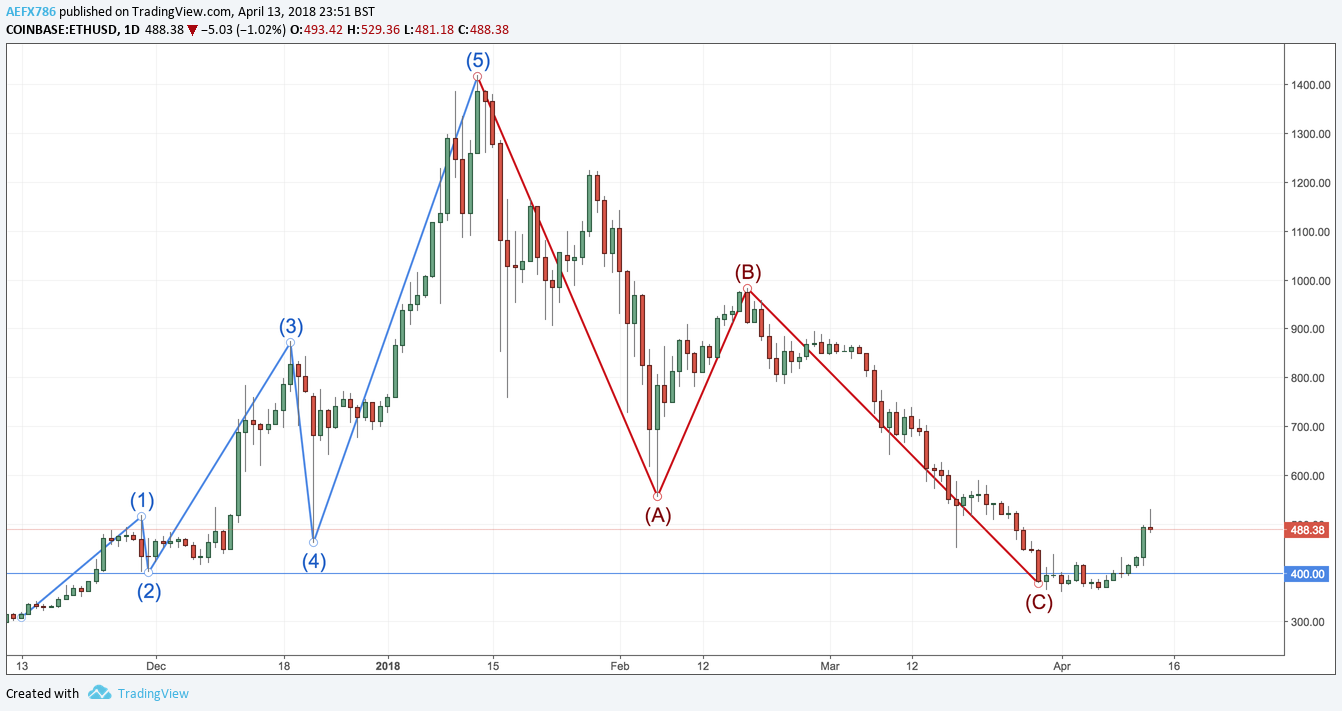
When using the Elliot Wave Theory, the daily timeframe shows us how price made a full market correction back to $400 and then traded sideways for a week - which is where we formed our textbook reversal (spinning top) on the weekly timeframe... right before breaking to the upside.
It's looking great so far - but again, it's too early to confirm anything. The daily candle has closed with a pinbar, rejecting higher levels. I would like to see the market pullback from here to abour $450, which would be testing support from the highs of the previous weeks trading... before making another run for a higher high.
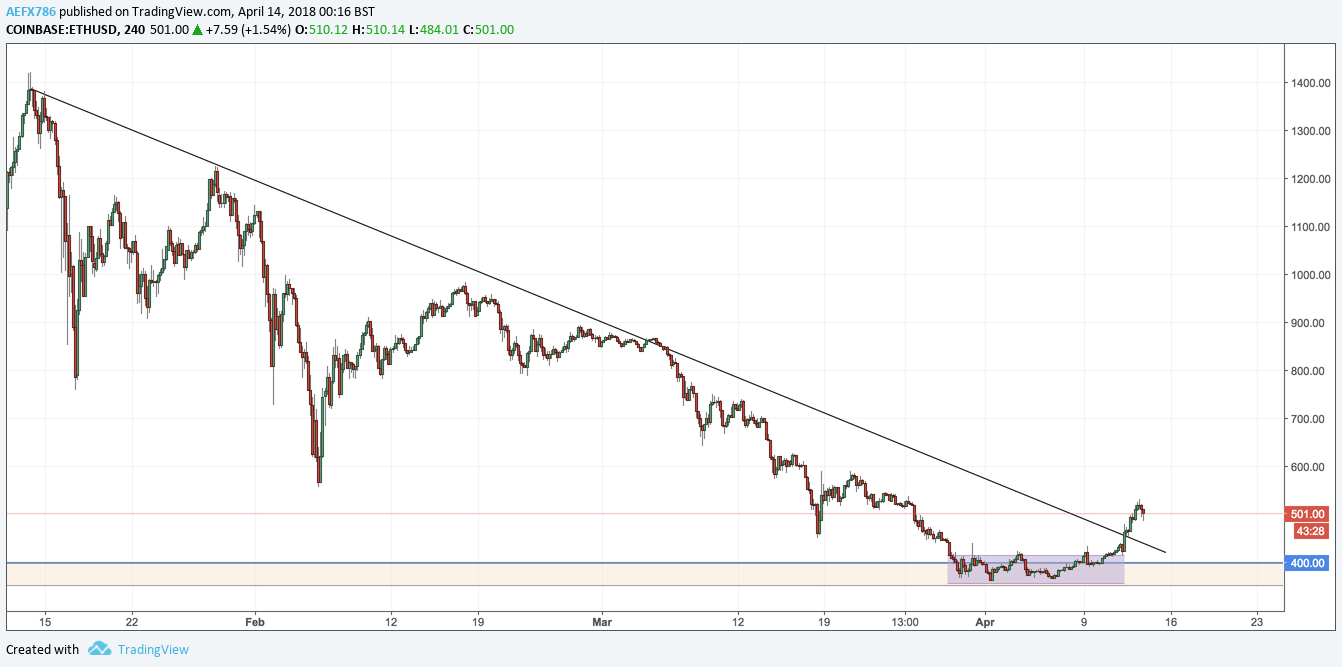
ETH/USD H4 Timeframe
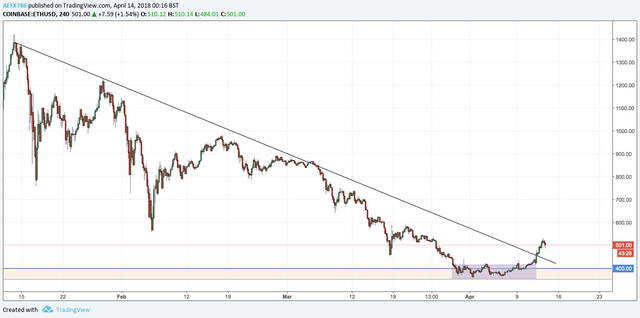
Now, this is where things start to get a little interesting. You can see the markets long downtrend and then the week of sideways trading on the $400 Even-Number Psychological Support Level before the market broke to the upside - breaking out from the downtrend.
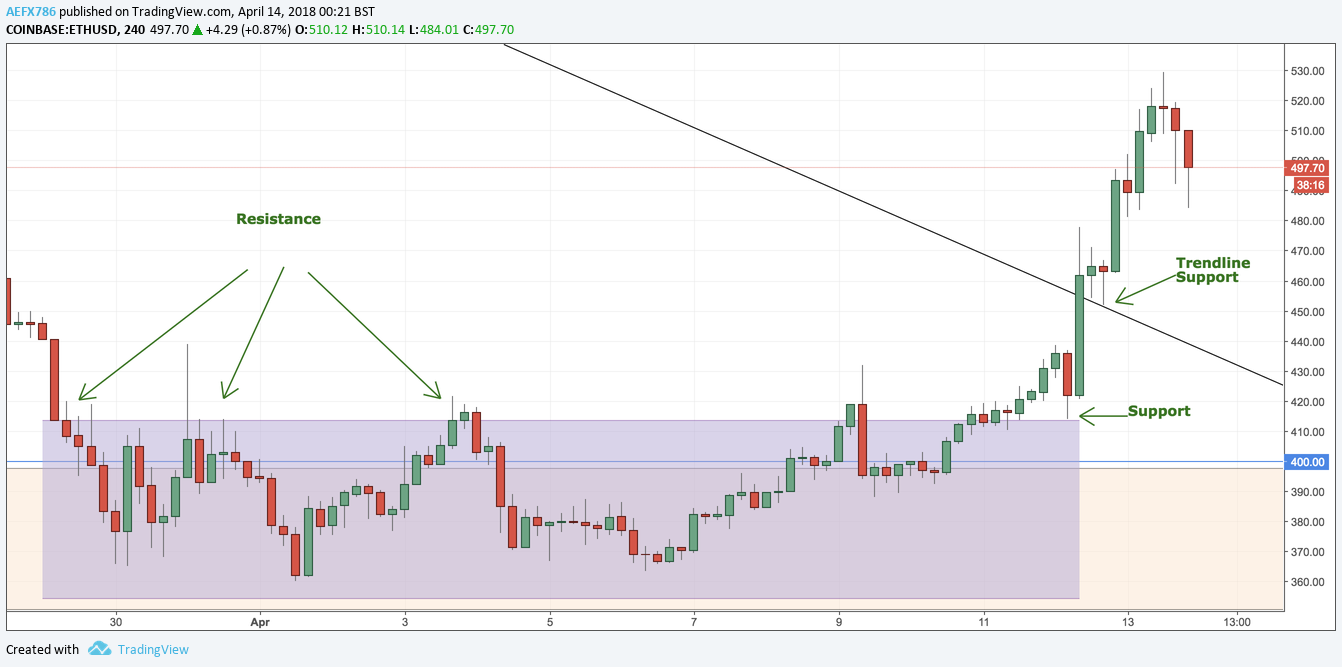
Let's take a closer look at the sideways action, the market tried multiple times to break above before finally closing above the resistance level. The break above resistance was followed by a large bearish candle, however, it failed to breach the 'resistance > now support' level and closed above. This gave the market the much-needed support to make a break for that downward trendline and notice how with a single attempt, a large bullish candle breached and closed well above the downward trendline.
The breakout followed by two retest candles, confirming previous resistance is now acting as support and again, it gave price the trendline support needed to push higher. The last three candles show a correction/pullback but we're still making higher highs and higher lows. It is healthy to pullback and for the market to correct before pushing higher, as previously stated... we need the pullbacks because they provide support for the next push... with that said, let's now zoom in to the hourly timeframe.
ETH/USD H1 Timeframe
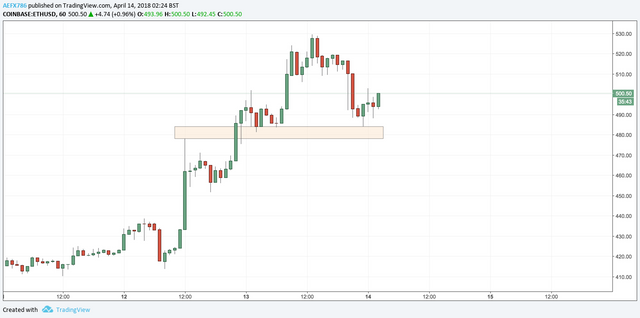
The 1-Hour timeframe shows a clear 'Break & Retest'. The market made higher highs and higher lows before making a deeper pullback, whilst still making a higher low. It pulled right back to the previously retested level for support and is now moving back to the upside as we speak.
The entire crypto-market has been on sale for the first quarter of 2018 and we've managed to secure investments at some great prices. It's now time to see which way the markets want to go and for the short term it's looking quite positive - let's see if this is the start to the next uptrend.
I hope that my analysis helps in your trading careers. If there are any pairs in particular you want me to analyse, please feel free to drop a comment below.
ETH is so oversold. ..return and more to its previous highs
Good post
Congratulations @aefx786! You have completed the following achievement on the Steem blockchain and have been rewarded with new badge(s) :
Click here to view your Board
If you no longer want to receive notifications, reply to this comment with the word
STOP