Ripple (XRP) Is It All Over?
At the start of January I predicted that Ripple will drop for a correction based on confluence in my technical analysis and expected price level was $1 with a possible dip below. Looking at higher timeframes, I expected a much deeper correction towards $0.50-0.60 but before we can drop this low, we needed to bounce back up towards $1.60.
I'm heavily invested in Ripple and many cannot understand why I am publicly calling out such bearish drops, so allow me to explain.
If you look at price movements in Forex, you will see it's perfectly normal for the market to move Up and Down and cryptocurrencies are no exception to the rule. Find a chart where price just keeps going up and tell me, what comes after the up move?
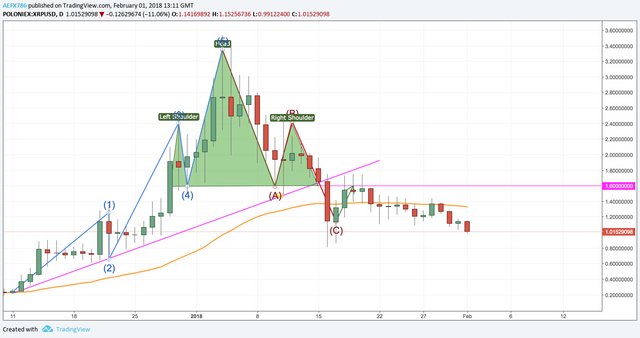
In order for the market to keep moving up, price needs to make a correction and it does so by pulling back to test a structure level - to find it's feet before making another jump. If we look at XRP on the 4-Hour it looks like it did find it's feet, with a good support level to make the next up move but in fact, that was just the completion of an ABC correction on higher timeframe and the next up move was simply the re-test of the $1.60 neckline I was calling out at the start of January!
If you look at the image above, you will see that the uptrend was in accordance to the Elliot Wave Theory (1,2,3,4,5). With the start of the ABC Correction waves, we went on to complete a Head & Shoulders pattern. The completion of the head & shoulders pattern also broke the rising trendline support. - When we break strong levels, what do we expect?
And that is exactly what happened. We completed correction wave C and went straight up from there to rest both the rising trendline support (testing as resistance) and also to retest the neckline of the Head & Shoulders pattern (testing as resistance).
Look at how the daily candles spiked up to test the rising trendline, which was previously support and was unable to break through. It held as resistance and the price dropped back down, with confluence at the $1.60 neckline the price was pushed down further to close below this level. We can see that price did in fact test these levels 3 times before giving up and dropping back down.
From there we can see price broke & closed below the daily 50ema, which was previously acting as dynamic support (now resistance). With the daily 50ema now pushing price down, this added confluence to our position that the price will drop further. We had a retest of the daily 50ema but failing to close above it, you can see that this week we've really made that deeper push down.
Is The Correction Over?
I don't think so. If we look at the weekly timeframe you will see we have an untested level which also runs in to the weekly 50ema. Price is attracted to whole number levels and I've enough confluence to say that a correction back to the $0.50 - $0.60 levels is possible.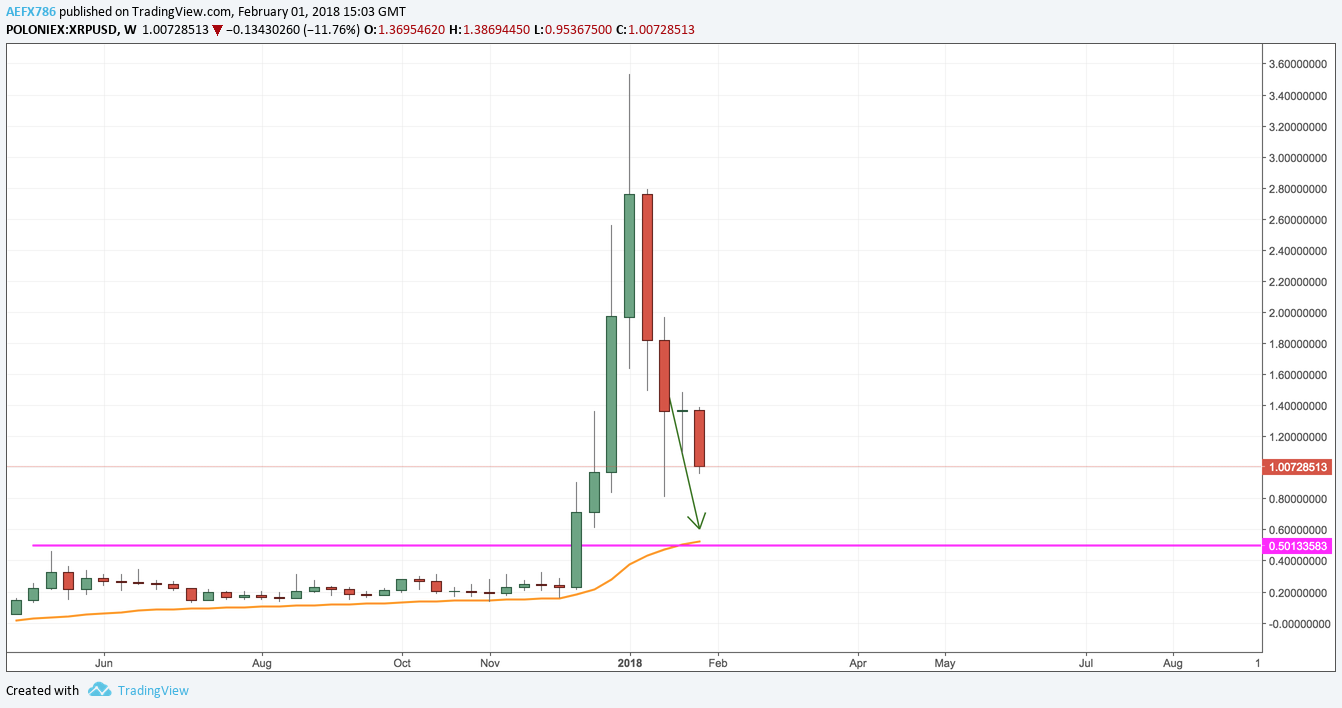
I hope this breakdown of my XRP analysis has been helpful in understand why I said Ripple XRP will remain bearish throughout January and will not go up to $2.00 again before Feb. If you've liked this analysis, please remember to hit the vote button and if you think it will help others, please resteem :)
Great post
Please follow me.If you give me upvote, comment i will gave you same.