BITCOIN: Retesting The Support
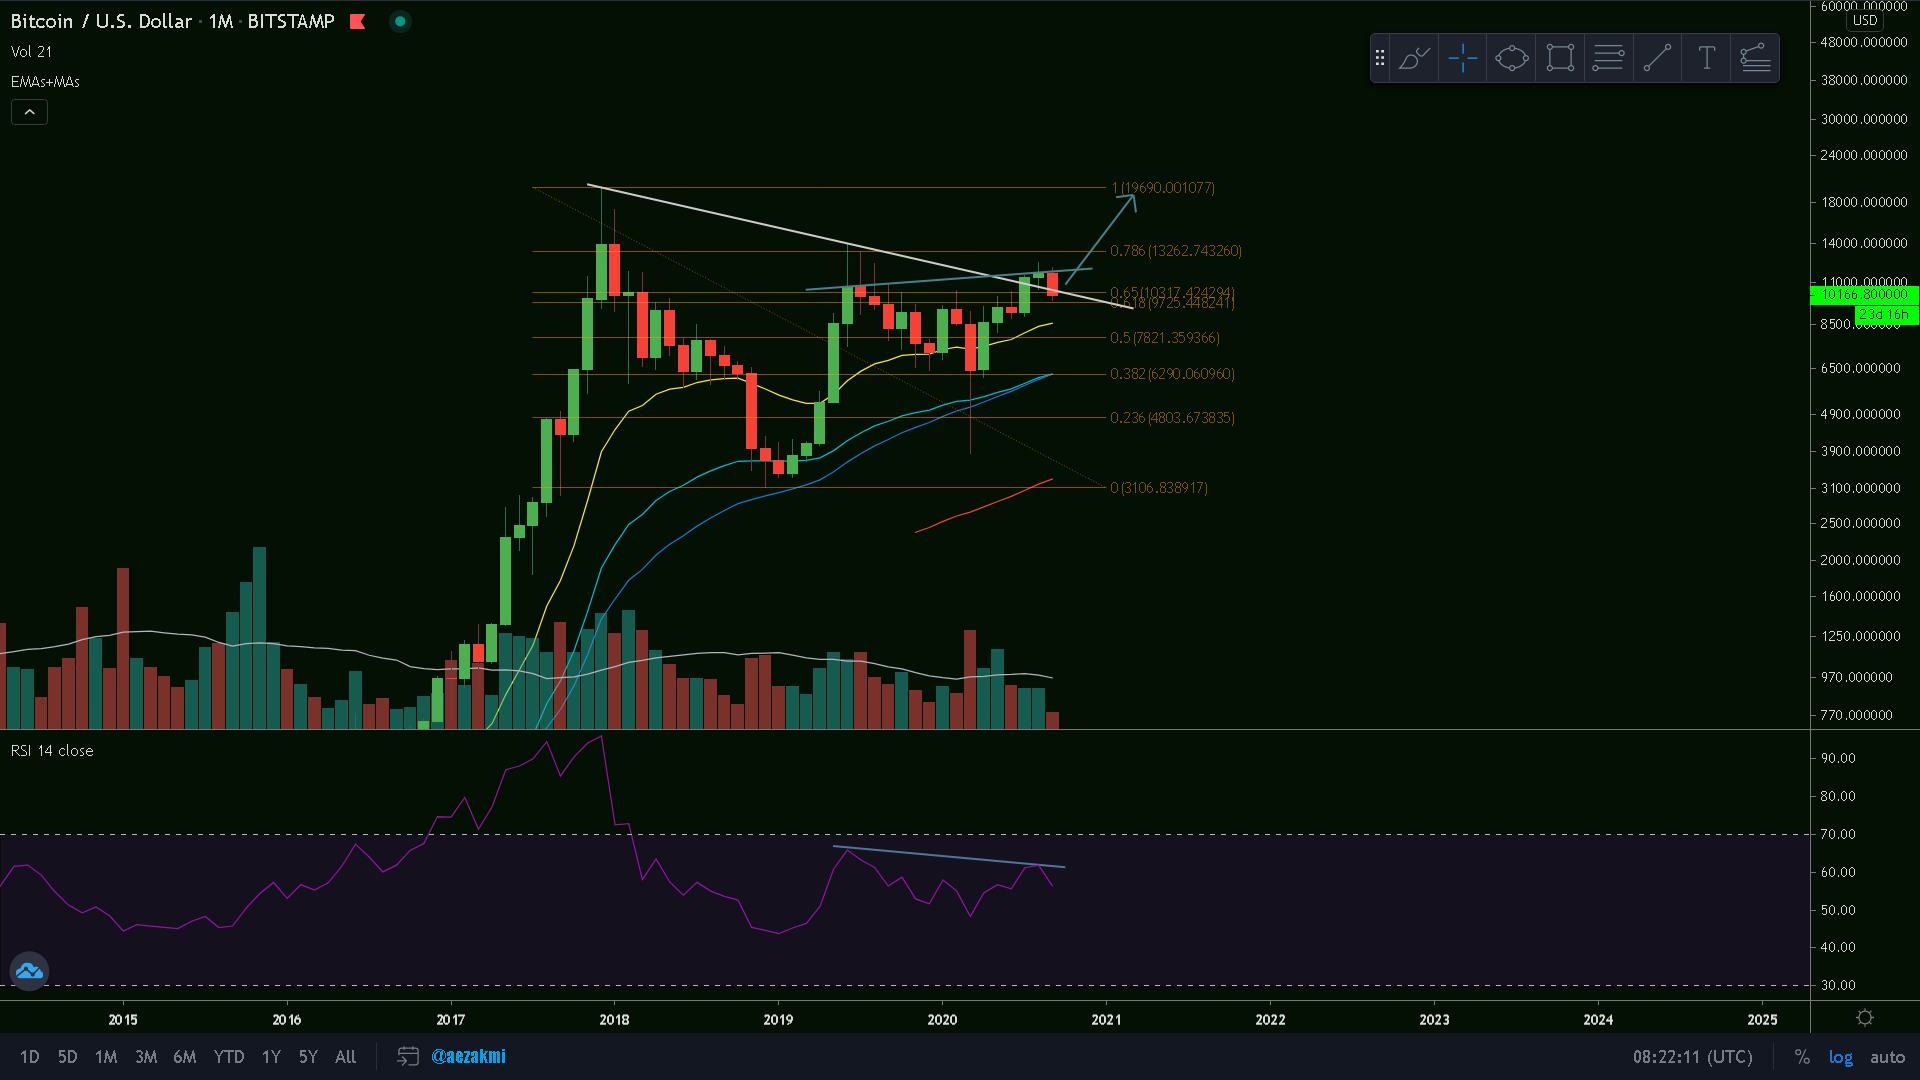
BTC/USD Monthly Chart
Since my last post Bitcoin was in a continuous sideways movement, without doing any major price changes. After getting a bearish divergence on the RSI, we're currently retesting the support back at the almost-3-year long descending trendline, which aligns with the 0.618 Fibonacci retracement. If this holds, we might see Bitcoin breaking the 0.786 ($13k) and heading towards the previous high by December 2020.
Ctrl + Click here to enlarge the image in a new tab (steemitimages)
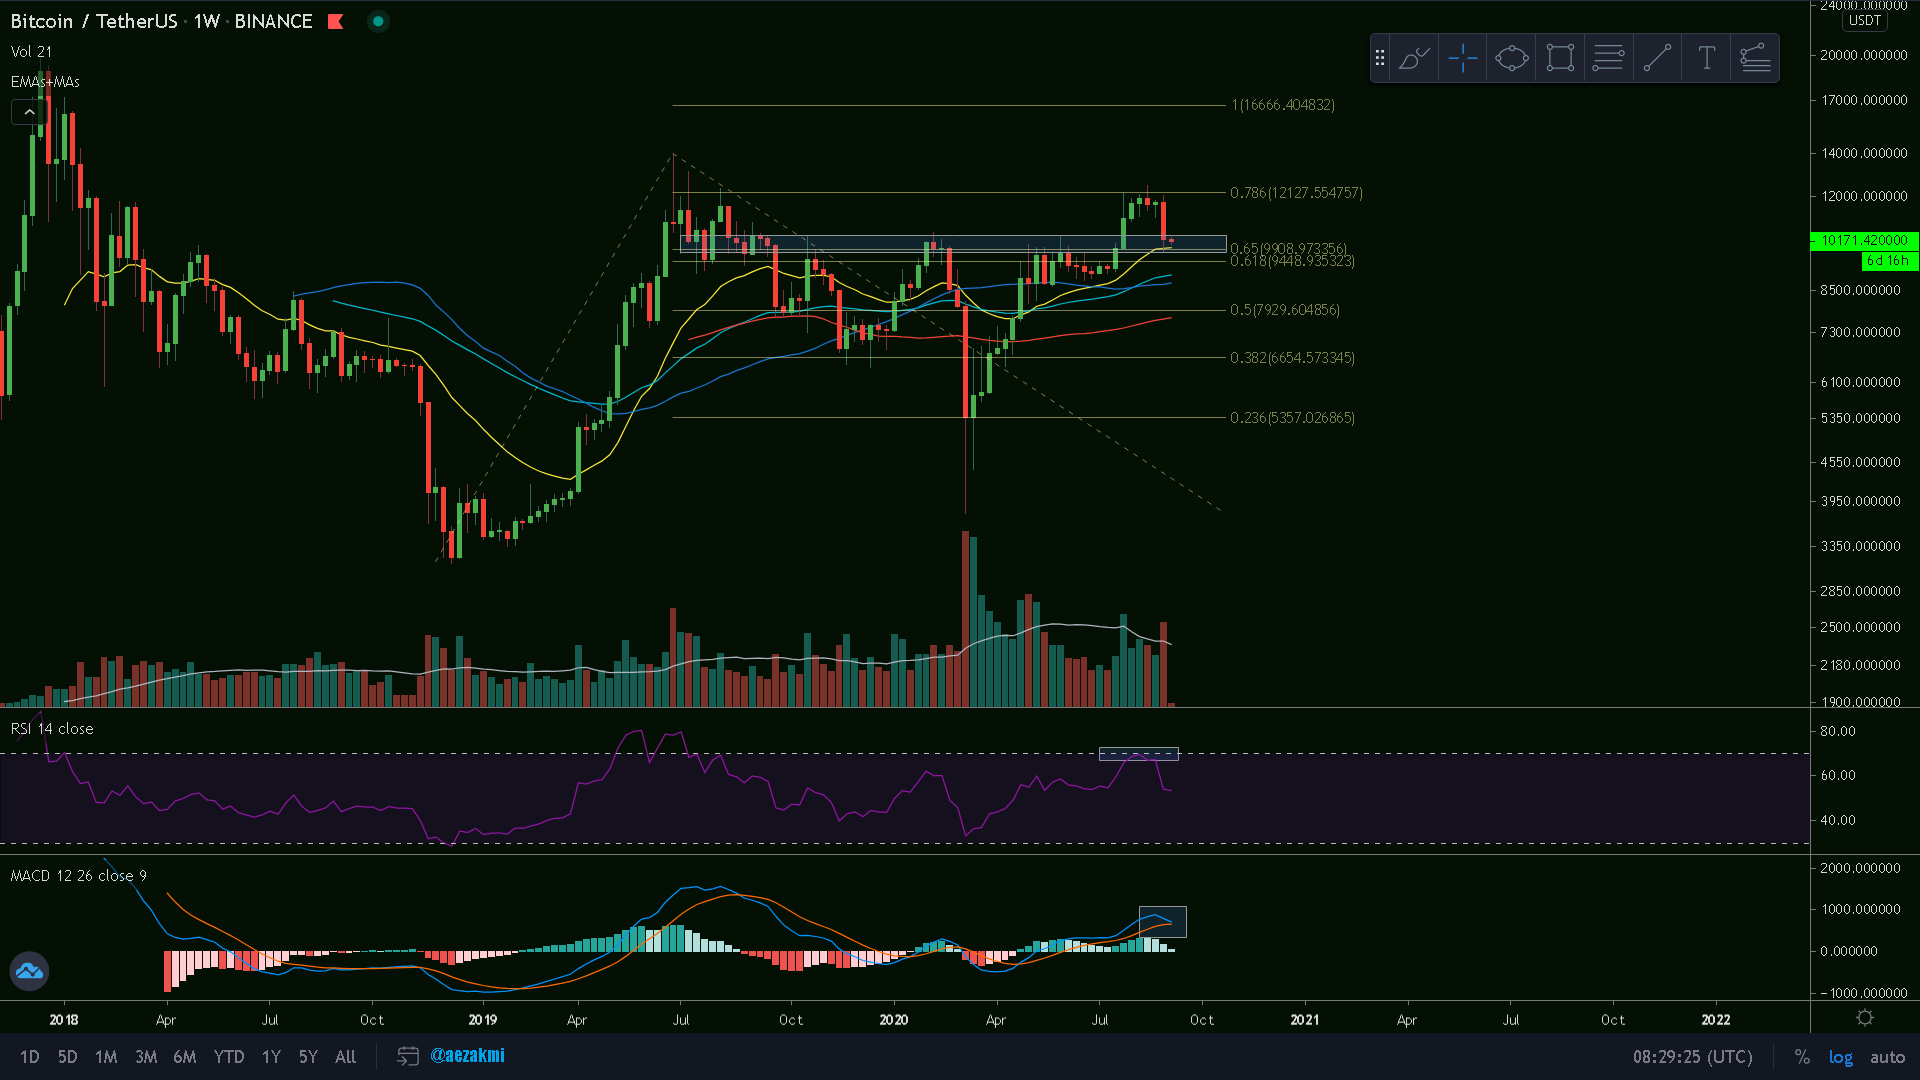
BTC/USD Weekly Chart
The weekly chart gives us a different perspective of the whole price action: we have Bitcoin reaching the 0.786 Fib. extension of the Dec. 2018 - Feb. 2020 movement, currently finding support near the golden pocket. This specific $9500-$10000 levels indicates a very strong support level; a lot of price action happened here in the past and the 21 EMA is here as well. As you can see, we got a rejection at the upper band of the RSI, but we have some sort of a bullish hidden divergence, higher low on the price and same low on the RSI.
If we're going to flip the 0.786 ($12k), we will probably see Bitcoin at the 1:1 extension ($16) in Q1 2021.
Ctrl + Click here to enlarge the image in a new tab (steemitimages)