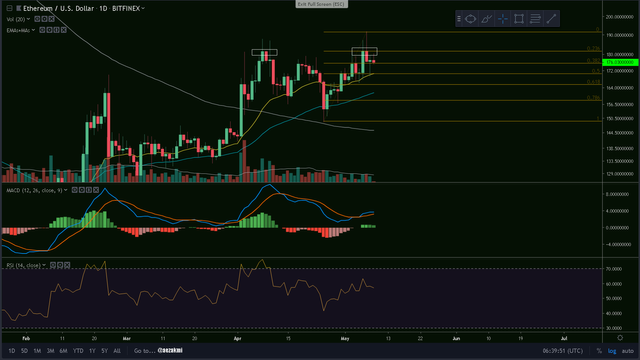
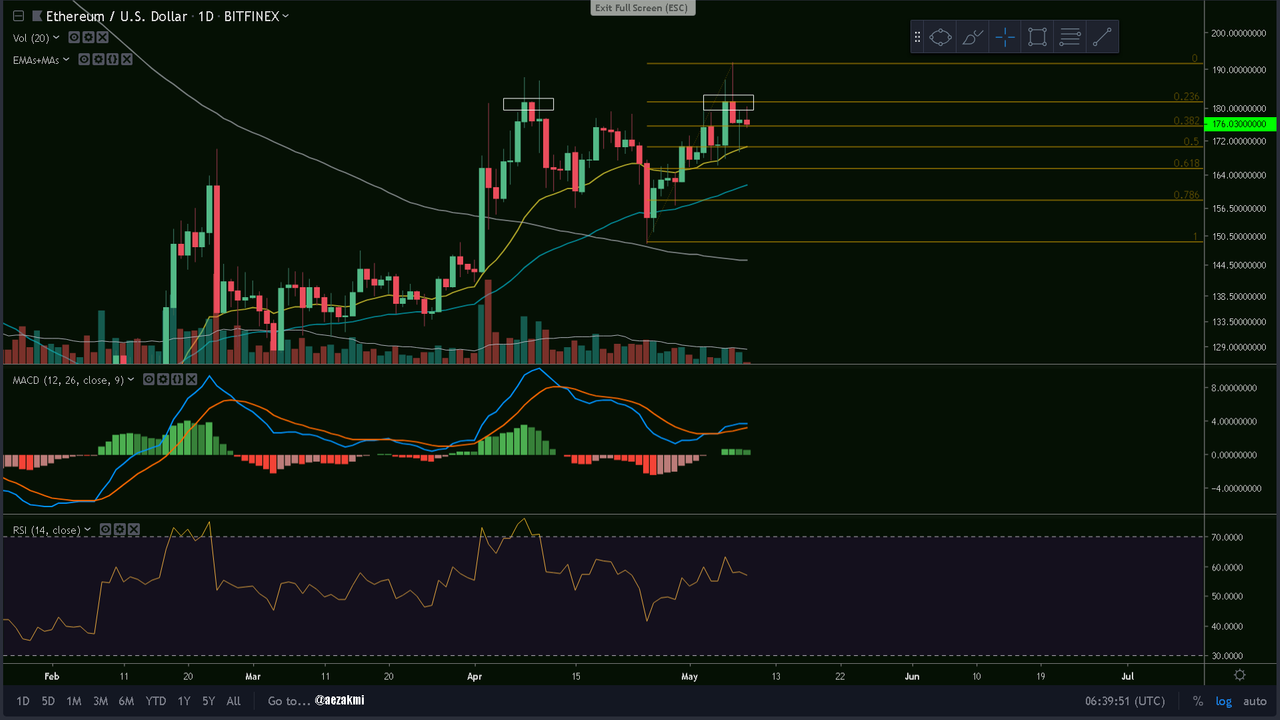
ETH/USD - Daily (1)
- a further tweezer top formation at the exact same level - 181$ brings us down again (rectangles)
- we find support at the 0.382 Fibonacci retracement
- the MACD showed us a bullish cross, but there no bullish MACD - Histogram building
- notice how the 21 EMA (yellow) and 55 EMA (blue) are carrying us
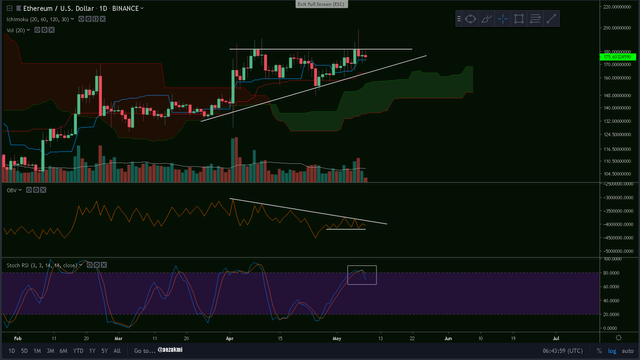
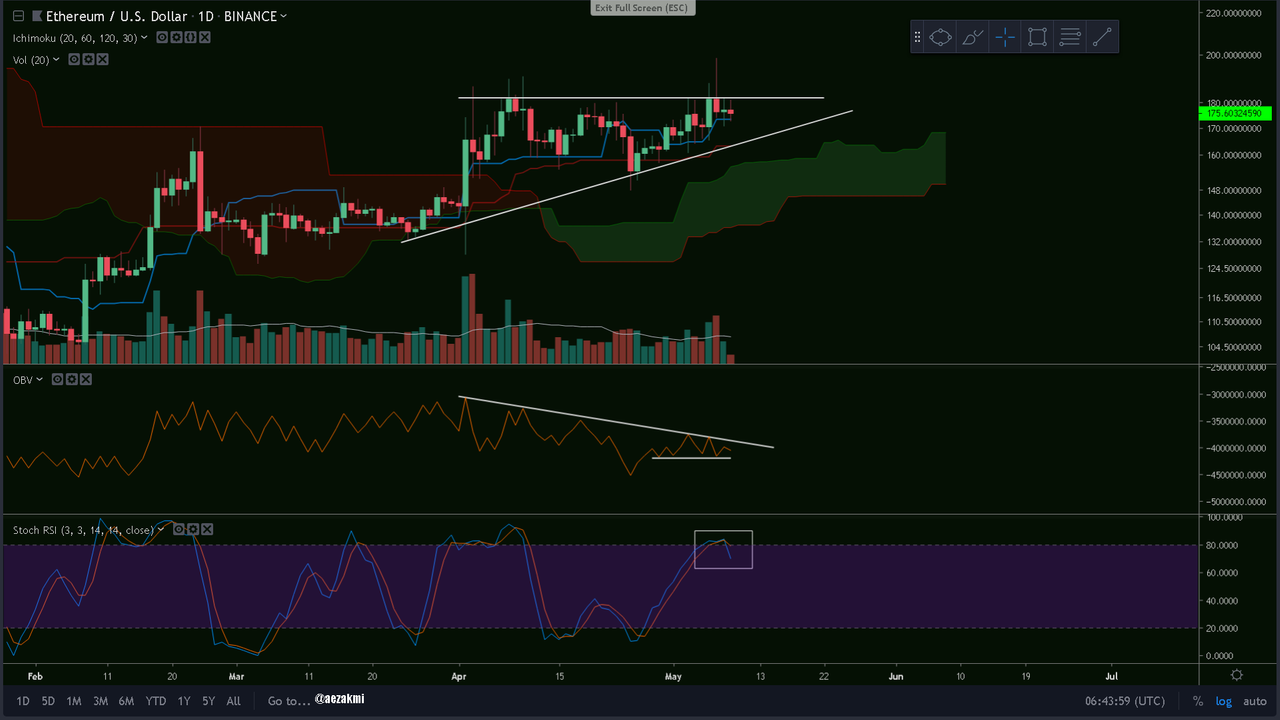
ETH/USD - Daily (2)
- it looks like we're forming an ascending triangle pattern, which is usually bullish and could end up in a price spike
- we have good Ichimoku conditions right now: finding support at the Tenkan and having a decent green cloud building
- the OBV however is descending, which suggests that the bulls are running out of momentum
- the Stoch RSI indicates a bearish cross, which could mean a revisit at the lower trend line of the triangle formation
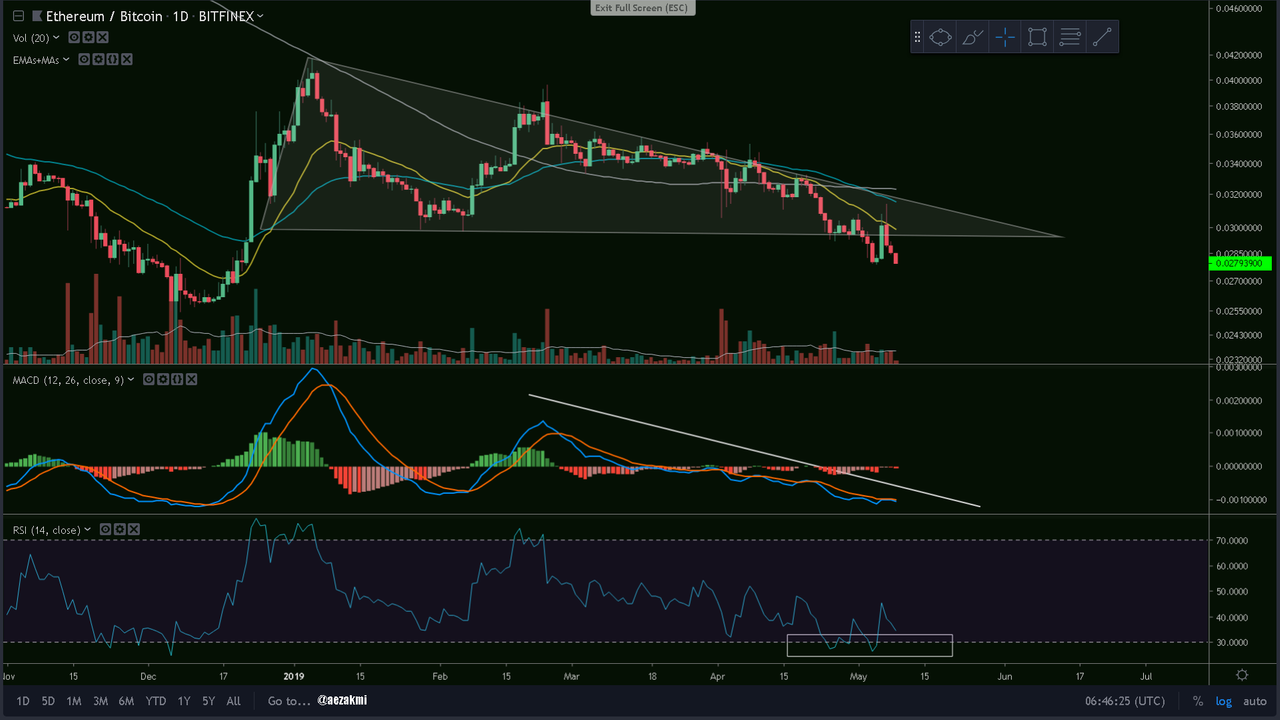
ETH/BTC - Daily
- we lost the support in this long descending triangle pattern and had a pretty harsh breakdown
- we had a lot of MACD rejections at the signal line along the way, so a bullish cross could finally suggest a possible strong bullish rally
- the RSI bounced twice from the oversold area and now a bullish divergence is probably going to form

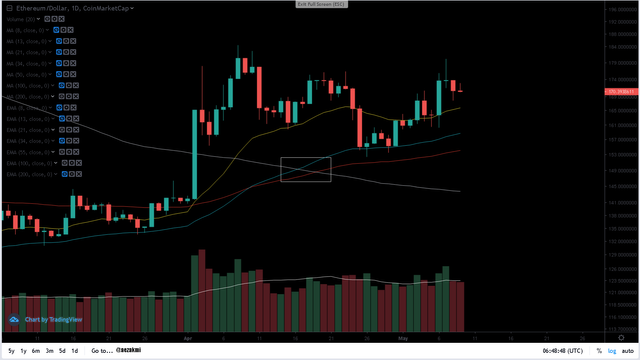
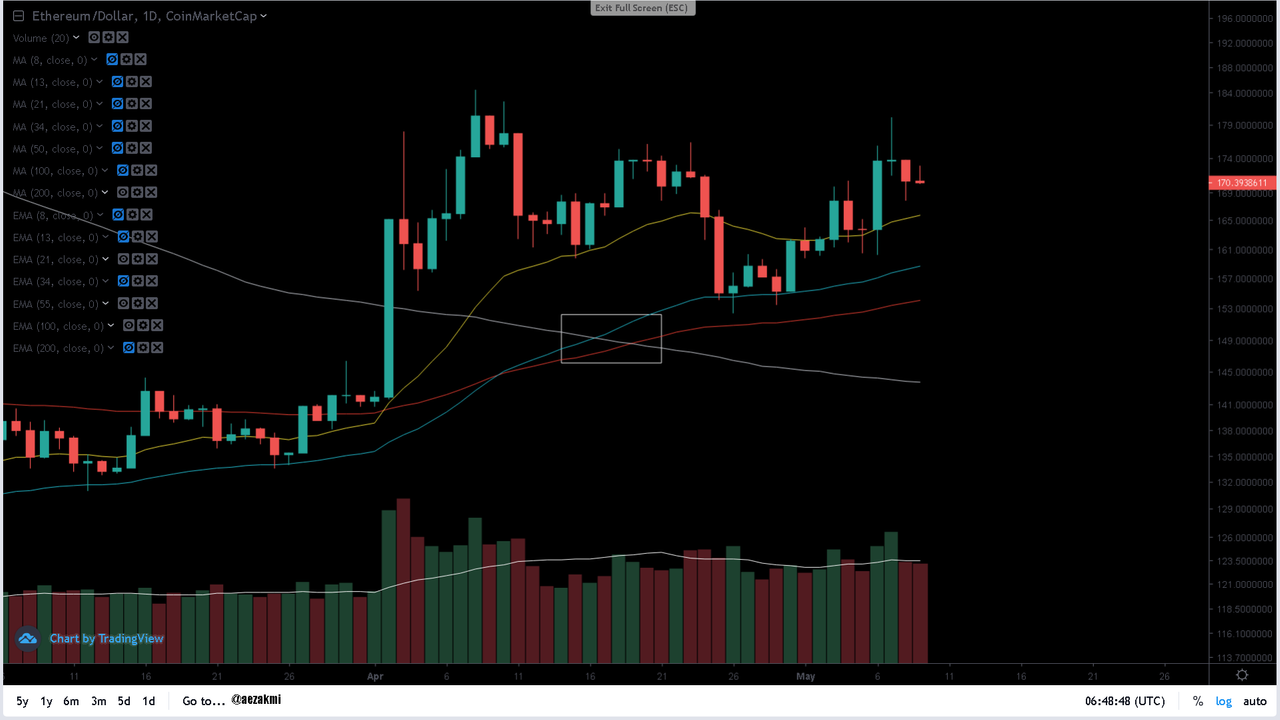
Moving Averages
- a better look at how the 21 day EMA (yellow) and the 55 day EMA (blue) are carrying us for now
- the trading volume is quite stagnant for now
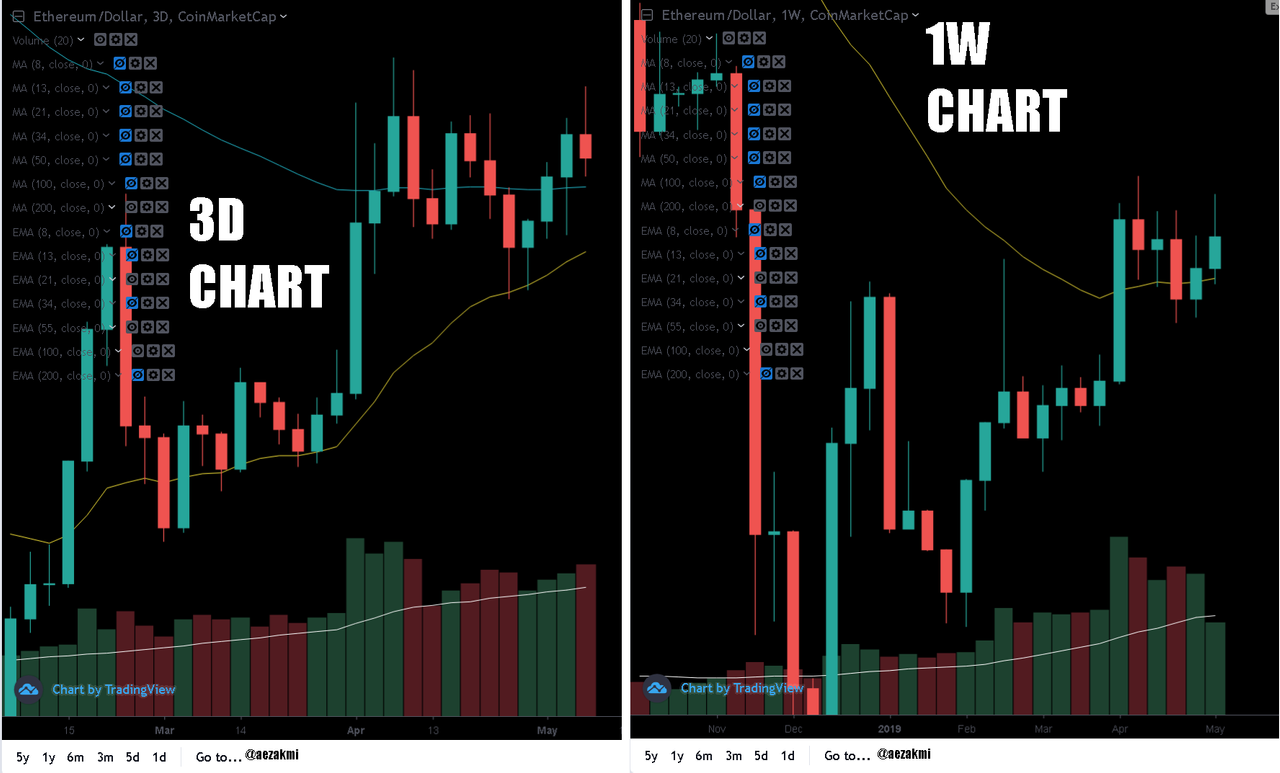
More Averages
- it looks like the 21 and 55 EMA's are having an important role on the 3 day chart too: 21 (yellow) acted as support since March and now the 55 (blue) is here to support us too
- the 21 is showing up also on the weekly chart, acting as support
