Daily Analysis GBPJPY- Potential Entry Opportunity For Today (March 19, 2018)

Today, GBPJPY has an interesting setup for our daily trading. Where since a few days ago, this pair seems to move in a pattern.
Check out GBPJPY in the following 4 Hour Chart:

Seen from the chart above, GBPJPY is moving in a range that does not show any strength in selling interest when breaking the lower limit of previous Raising Wedge pattern (Black Line). I try mapping the price in its rangen zone (Blue Box), where the price reaction on each of these zone boundaries will likely help to confirm how strong the interest of the transaction is.
For today's entry reviews, let's look at GBPJPY in the following 1 Hour Chart :
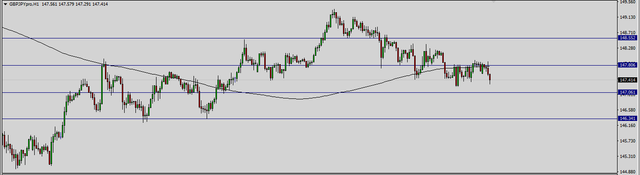
Based on the picture above,
I have determined the following Intraday Support and Resistance Levels:
Resistance2 (R2): 148.55
Resistance1 (R1): 147.81
Support1 (S1): 147.06
Support2 (S2): 146.34
From the image above, it looks like GBPJPY yesterday moves only weakly in a small range of moves (the limits are represented by R1 and S1 levels today), so the price reaction on these limits will help us read the direction of price or transaction interest.
In my view, the direction of the price will be better confirmed when the price is able to break the zone over the range with the price explosion, so we can avoid false signal / false breakout better. Keep it objective when applying your plan method with this analysis.
Level R1 and S1 level today will measure how much pressure will be obtained today from the Buyer or Seller side so that the price reaction (Breakout or Rejection) on one of these levels will clarify the entry opportunities and price direction for today.
Be aware of the consolidation pattern between R1 and S1 levels today.
Stay alert for false breakouts.