BTC 2018 11 04 - price variations
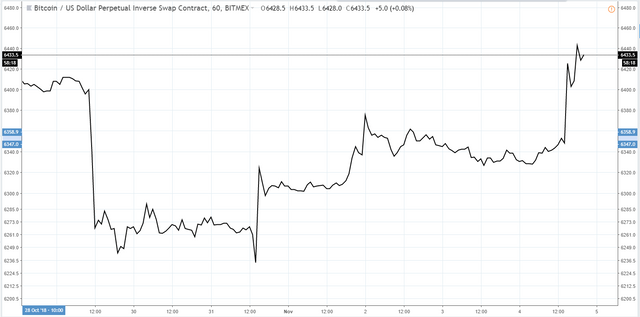
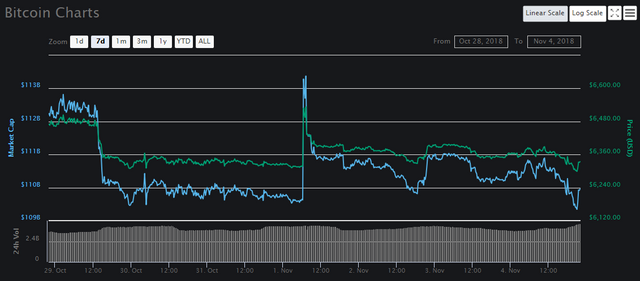
While analysing BTC charts on TradingView today, I was struck by how much they differed from the CMC sparklines
I was going to write about BTC longs and shorts today, but then something more pressing caught my attention.
BTC 2018 11 04 - price variations
Because I use the major exchanges and trading pairs on TradingView, I would expect them to mirror what I see on CMC. Usually this is the case, but not so when I looked a few moments ago.
I know that CMC can lag a bit, though if I remember correctly they now update data every minute. I also acknowledge that little sparklines are not the most accurate TA charts. Be that as it may, the discrepancy still puzzles me. I'm not saying that there is anything wrong with CMC (a site I use many times every day and which I have a lot of respect for), just that we need to be careful about which data we use.
I learnt this lesson the hard way not too long ago. I wrote this post about my experience: https://mentormarket.io/cryptocurrency/@bitbrain/updating-my-thoughts, I suggest that you give it a quick read.
I suspect that the cause of this difference may be that sites like CMC must have some sort of algorithm that combines prices from all the BTC trading pairs. I'm not sure how it weights them, but I suspect that low liquidity pairs cause the prices to lag because they have not necessarily "caught up" to the latest changes in price. While looking into this interesting phenomenon, I checked my other favourite "look at all the coins" site CoinGecko. (If you don't already use CoinGecko then go take a look at https://www.coingecko.com. Alternatively you can follow them @coingecko . In their most recent post they published their quarterly crypto report. The report contains a wealth of interesting data and is well worth the read.) The CoinGecko price for BTC was similarly divorced from what I was seeing on TradingView, slightly more so in fact.
Here is a chart from TradingView:

From TradingView
compared to this CMC sparkline:

From https://coinmarketcap.com
or even the weekly chart:

From https://coinmarketcap.com/currencies/bitcoin/
The differences between the CMC charts and the TradingView one are clear to see.
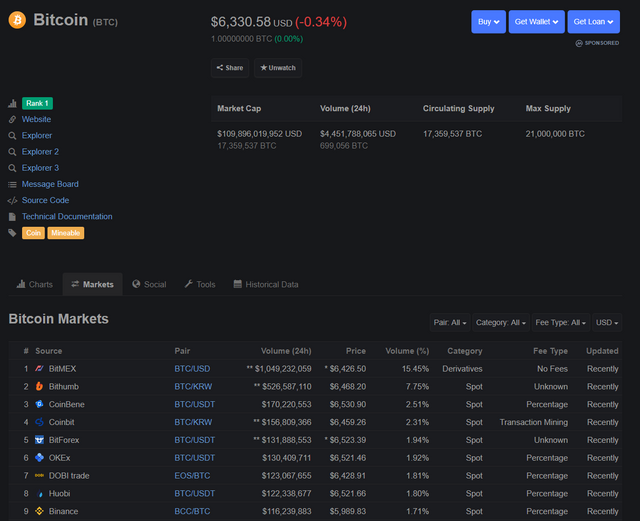
In case it was just the charts that were lagging, I looked at the numbers in the tables. These seemed to confirm my suspicions, with the BTC prices reflected being the same as what I was seeing on TradingView. As I looked lower down the CMC trading pairs, prices did indeed drop as the liquidity decreased.
This is what the top trading pairs looked like on CMC (arranged in descending order of volume):

From https://coinmarketcap.com/currencies/bitcoin/#markets
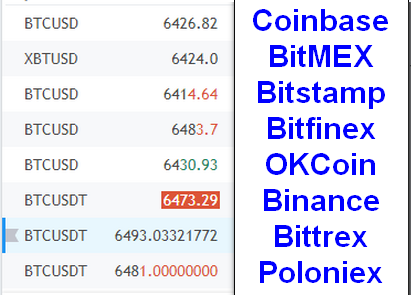
They compare well with these prices seen on TradingView:

Modified by Bit Brain from TradingView
Another interesting observation is that the Binance price of Bitcoin in Bitcoin Cash is very low. This only applies to Bitcoin cash. I attribute that to the approaching Bitcoin Cash fork (and the fact that Binance announced it would support the fork). Big forks in the past have certainly caused unexpected price movements. While I don't regard the Bitcoin Cash fork as major news (like major forks of Bitcoin itself or the birth of Bitcoin Cash were), it is receiving a lot of attention. We can clearly see this in the spiking price of BCH today. Perhaps it is this BCH price spike alone that is pushing the average price of Bitcoin down and is affecting the average prices on CMC and CoinGecko.
Conclusion
I'm sure that this discrepancy will soon vanish. As I said earlier, nobody is in the wrong here, it's just one of those things. I expect that more like it will continue to crop up while crypto is still relatively young and susceptible to large variations in price as whales or market sentiment push prices around rapidly. My message today is a reminder (to you and to myself): always check your data with multiple good sources, specifically if you are about to execute a trade.
Yours in crypto,
Bit Brain

Bit Brain recommends:
Published on

by Bit Brain


Trading View has the actual exchange price but the websites that consolidate the price feedback use a weighted average that also excludes some prices that are deemed to outliers due to instruments traded (like Futures) or liquidity concerns (inability to withdraw or deposit). While they have been mostly aligned, some differences remain.
I've just never tracked a consistent $150 (approx) difference before. A rather strange anomaly.