$BTC #BITCOIN - IT IS FINALLY OVER - NO MORE $4000
Hello Lads and Ladies,
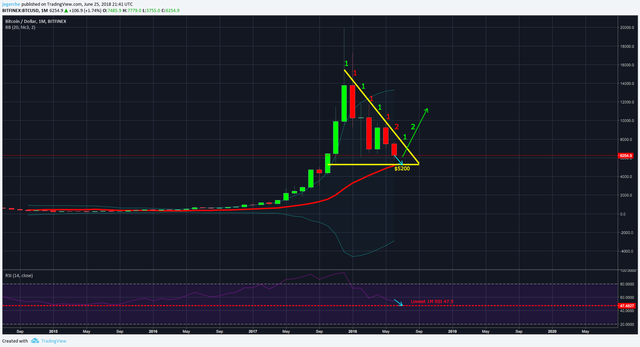
We will start today with the monthly overview of BTCUSD.
What we see here is a wedge forming after the parabolic increase starting in 2017.
This was a very healthy move that was expected and has driven a lot of conspiracies with it such as various manipulations or sell offs - at the end this was just a healthy movement.
Nevertheless, we see that during this wedge we have green and red candles alternating 1 by 1.
For the first time, we might see this monthly candle closing below the opening of the previous candle. This would have a very high chance of having the next candle closing above this one and with it indicating the start of the trend reversal.
The possibility I see here, is what I have been saying almost this whole month, that we will have one last dip, reaching for $5200 but at least $5600, as I have shown the reasons for it yesterday. Moreover, with hitting $5200 we would hit the middle of the Bollinger Bands AND have the monthly RSI at its lowest recorded level - all of this indicating a HUGE bounce and with it a trend reversal.
Now lets take a look at the weekly.
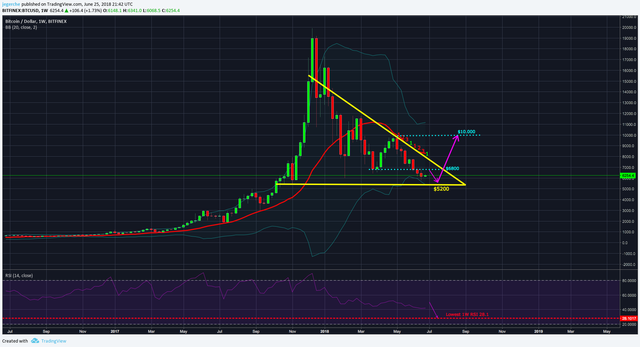
Here we can see exactly the same situation playing out.
Especially if you take a close look at the downtrend resistance, you can see that this yellow line has been confirmed multiple times.
Now, after the short uptrend of 4 weeks (4 green candles) we have hit the downtrend resistance and seen a retracement with 3 weeks red and one week green.
Therefore, I highly expect this week to close above where we opened yesterday and the following week, I expect it to hit once again the downtrend resistance and then retrace down under the last candle. AGAIN in a 3 week steps go down to the very bottom.
AS WELL, by doing so weekly RSI would reach its ever recorded lowest point of 28.1 points.
Hitting downtrend resistance at $7500 would be also hitting the middle of the Bollinger Bands.
In NUMBERS - CLOSE this week around $6800. Next weeks HIGH would be $7500 and CLOSE under $6120.
The LOW of the second red candle would be at $5600 and the LOW of the THIRD candle at $5200.
I will cover the reasons for the trend reversal in the following days and show where and how we might proceed in with the new trend.
Make sure to check it out on Tradingview - https://www.tradingview.com/u/jegerche/
Instagram - https://www.instagram.com/bitcoin25.de/
Twitter - https://twitter.com/mreucho/
 me and you will find this page interesting because I am a TA expert and day trader that does daily updates and new posts about the hottest and most discussed coins.
Cheers, Tomas